Figure 5.
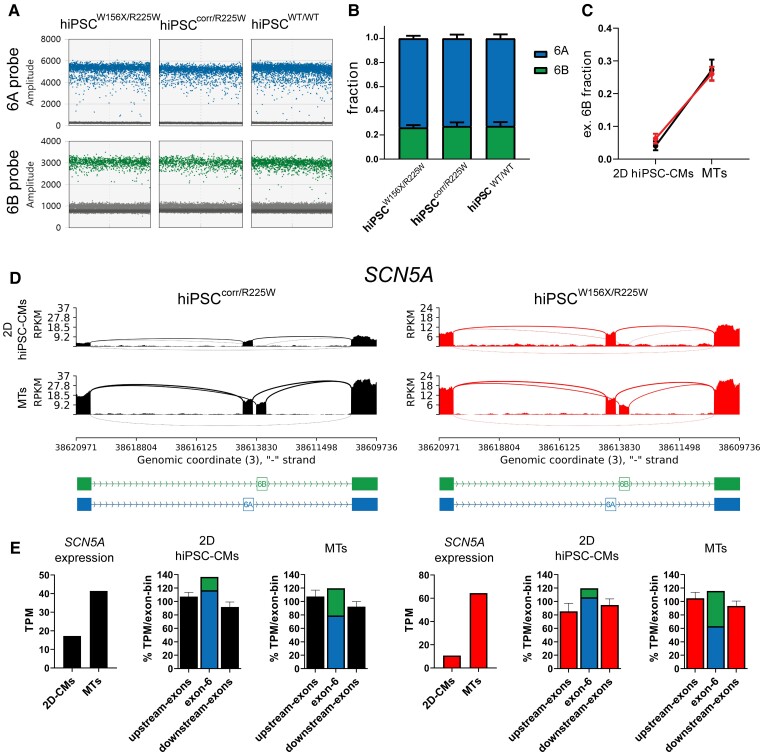
SCN5A exon 6B expression is increased in MTs compared with monolayer hiPSC-CMs. (A) Representative outcome of the ddPCR assay showing exon 6A (blue) and 6B (green) expression in hiPSCW156X/R225W-, hiPSCcorr/R225W-, and hiPSCWT/WT-CMs. (B) Bar graph of the average fraction of SCN5A exon 6A and 6B expression in hiPSCW156X/R225W-, hiPSCcorr/R225W- and hiPSCWT/WT-MTs (n = 3). (C) Plot showing the fraction of SCN5A exon 6B expression in monolayer (2D) hiPSC-CMs compared with MTs for hiPSCcorr/R225W (black) and hiPSCW156X/R225W (red), indicating a strong increase of the relative expression of exon 6B in MTs. (D) Sashimi plots of RNA-seq data from 2D hiPSC-CMs and MTs for hiPSCcorr/R225W and hiPSCW156X/R225W showing increased expression of SCN5A exon 6B in MTs in both lines. (E) Bar graphs from RNA-seq data (TPM) from hiPSCcorr/R225W (left, black) and hiPSCW156X/R225W (right, red) showing increased expression of SCN5A and higher fraction of exon 6B-including transcripts in MTs compared with 2D hiPSC-CMs.

