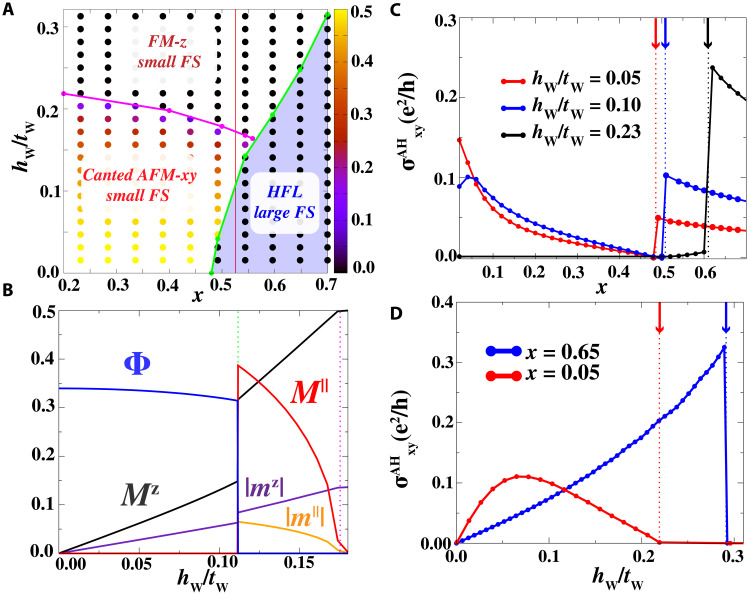
Fig. 4. Phase diagram and transport in magnetic field.
(A) Phase diagram plotted as a function of the W-layer carrier concentration x and the out-of-plane magnetic field hW. The blue region denotes the HFL regime where the hybridization order parameter is finite. The color code before the green line shows the value of the in-plane AFM order parameter M∥. The solid green line shows the first-order phase transition line. On the other hand, the magenta one shows the second-order transition from the canted AFM-xy to the FM-z. (B) Evolution of the variational parameter along the line cut at x = 0.52 as a function of hW/tW. (C) Intrinsic contribution to the anomalous Hall conductivity for three different values of the Zeeman field. The vertical dashed lines denote the critical filling where the first-order transition takes place. (D) Intrinsic AHE for different values of the filling x as a function of the Zeeman field. The vertical dashed line denotes the first-order transition between the magnetic and the HFL phase, while the solid one denotes the second-order transition from a canted AFM to the FM-z. Above this line, the AHE vanishes. The calculation has been performed at JK/tW = 1, JH/tW = 0.05 (bandwidth 9tW).

