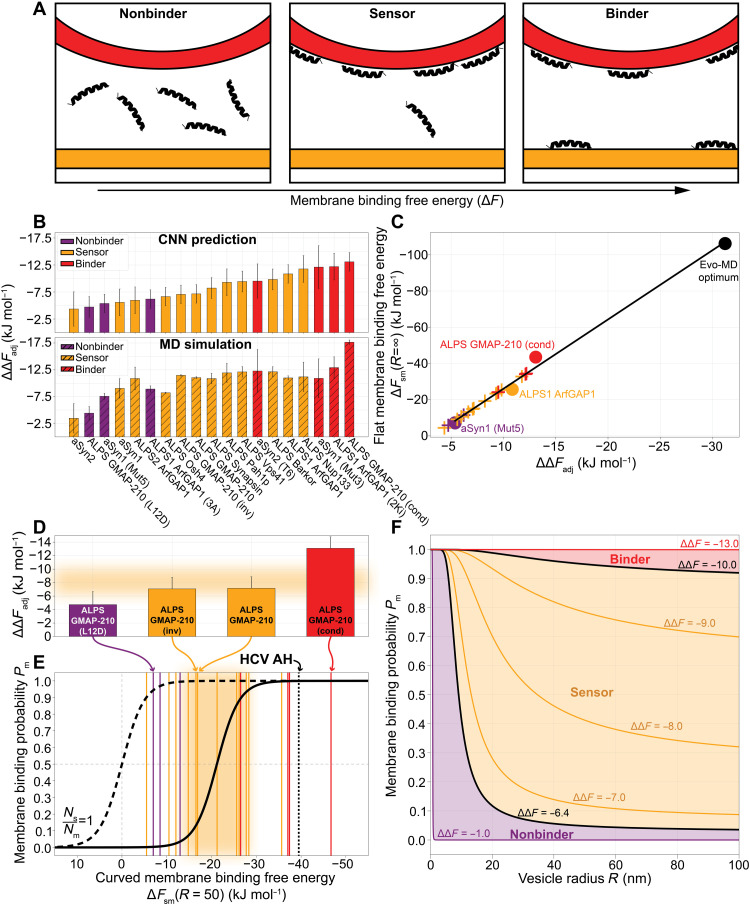
Fig. 4. Distinguishing sensors from binders.
(A) Nonbinders do not bind to membranes; sensors only bind to curved membranes; binders bind to any membrane, independent of curvature. (B) ΔΔFadj for 19 benchmark peptides (table S4) predicted with the CNN model (top) and calculated from MD simulations (bottom). (C) Linear correlation between CNN-predicted ΔΔFadj and the flat membrane binding free energy ΔFsm(R = ∞). Circles indicate peptides for which ΔFsm(R = ∞) was calculated by thermodynamic integration (section S10). The Evo-MD optimum (black) is the sequence in Fig. 2D. For the remaining peptides (crosses), ΔFsm was derived from the linear fit ΔFsm = 3.83 × ΔΔFadj + 12.27. (D) Highlighted ΔΔFadj values for ALPS GMAP-210 variants. (E) The membrane binding probability Pm as a function of the membrane binding free energy ΔFsm (section S10 and Eq. 2), at a vesicle radius R = 50. In (D) and (E), the orange area indicates the likely regime (0.05 ≤ Pm ≤ 0.95) where peptides are empirically classified as sensors. (F) Membrane binding probability Pm as a function of the vesicle radius R for a range of sensing free energies ΔΔF (section S10).

