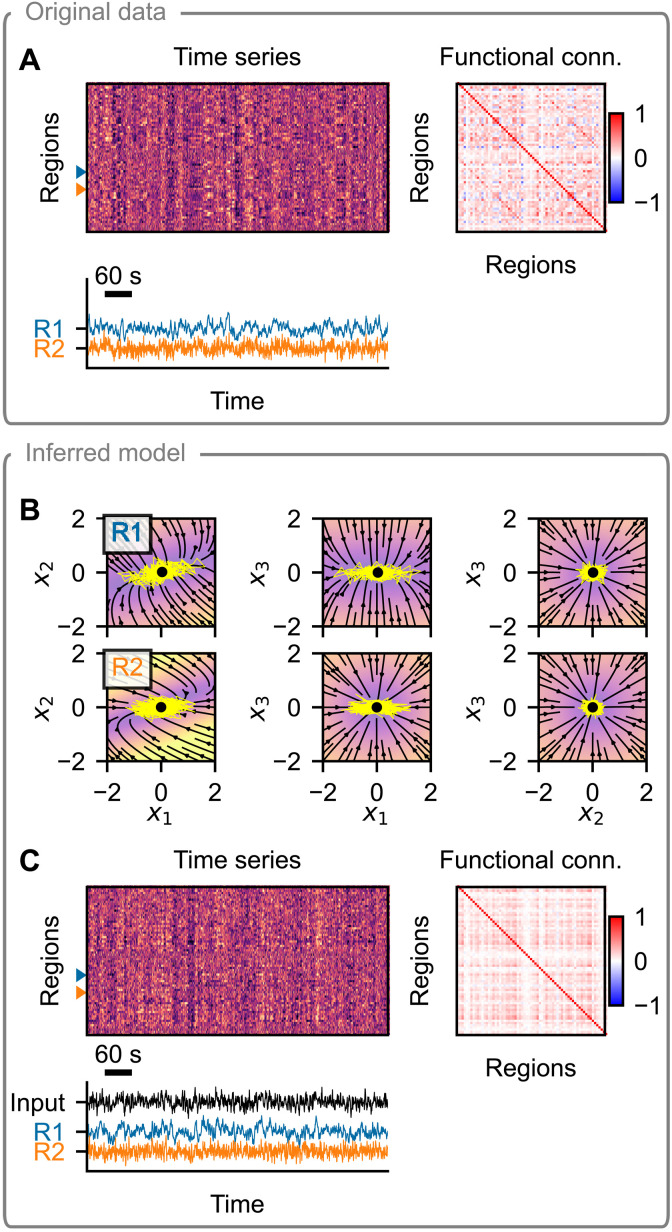
Fig. 5. Example of model inference on a single subject from the HCP dataset.
(A) Resting-state fMRI data (top left), corresponding FC (top right), and time series of two example regions (bottom). (B) Phase plane of the inferred dynamical system. Each panel shows a 2D projection of a 3D system, with the third variable set to the position of the fixed point (black dot). The vector field is evaluated assuming zero network input and using the inferred region-specific parameters. Background color represents the velocity magnitude; yellow lines are exemplary simulated time series of the node activity when embedded in a network. (C) Data generated by the inferred model. The regional parameters are set to those inferred, while the system and observation noise is random. The external input is generated randomly using the inferred parameters. Layout is the same as in (A).

