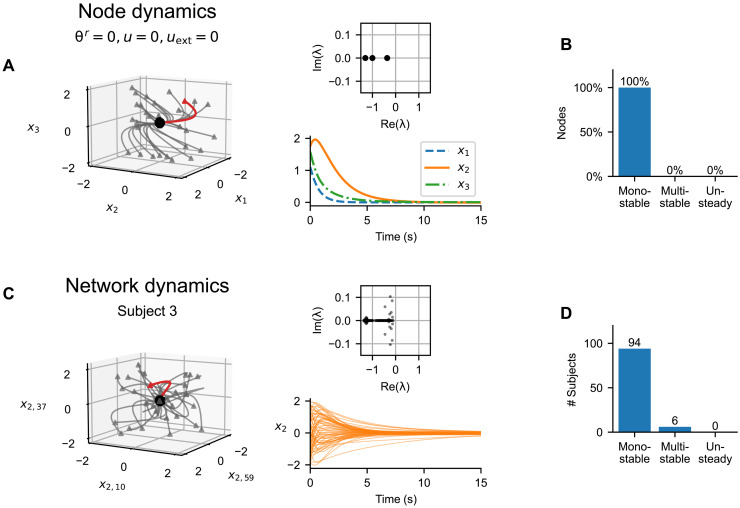
Fig. 6. Discovered node and network dynamics.
(A) Node dynamics for an uncoupled node with θr = 0, u = 0, and uext = 0. The left subpanel shows the trajectories from random initialization points (triangles) to the stable fixed point (black point). The red trajectory is visualized on the bottom right subpanel; the top right shows the eigenvalues of the system at the fixed point. (B) Inferred dynamical regimes of the uncoupled nodes. We analyzed the discovered system for 680 inferred parameter configurations and nine combinations of u and uext (see the main text). (C) Network dynamics for a single subject using the known structural connectome and inferred regional parameters. The left subpanel shows the trajectories from random initialization points (triangles) converging to the stable fixed point (black point) in the absence of system noise in three selected dimensions (x2 in three nodes). The red trajectory is visualized on the bottom right subpanel; the top right shows the eigenvalues of the system at the fixed point. (D) Inferred dynamical regimes of the subjects. We analyzed the network dynamics using the inferred regional parameters and the known structural connectomes. For each subject, we repeated the analysis four times using different samples from the posterior distribution, with uext = 0. In the chart, we show the number of subject for which at least one sample of parameters produced multistability.

