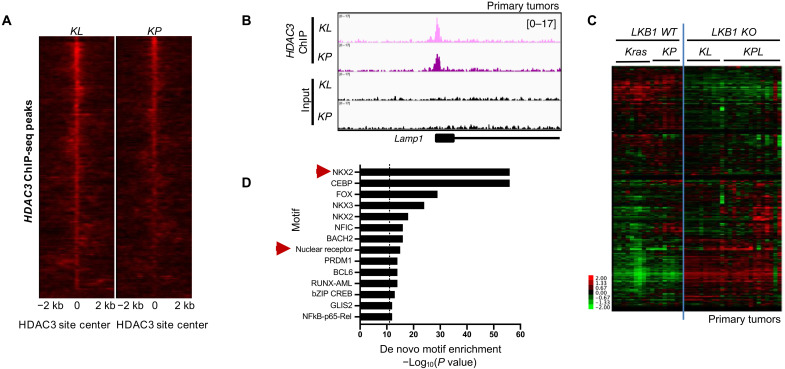
Fig. 2. HDAC3 genome occupancy in primary tumors.
(A) A total of 1522 HDAC3 ChIP-seq peaks common to KL and KP primary tumors. (B) Example of HDAC3 ChIP-seq peaks at genomic regions bound by HDAC3 in both KL and KP primary tumors. (C) Heatmap of RNA-seq data showing FPKM (fragments per kilobase of transcript per million) read counts from primary tumors from LKB1 wild type (Kras and KP) and LKB1 knockout (KO) (KL and KPL) models for the 753 nonredundant genes associated with at least one HDAC3 ChIP-seq peak within 25 kb of the TSS. Kras, KrasLSL-G12D/+; KL, KrasLSL-G12D/+ Stk11−/−; KP, KrasLSL-G12D/+ p53−/−; KPL, KrasLSL-G12D/+ Stk11−/− p53−/−. (D) Homer de novo motif enrichment analysis of the HDAC3-bound peaks in (A). All significantly enriched motifs are listed.

