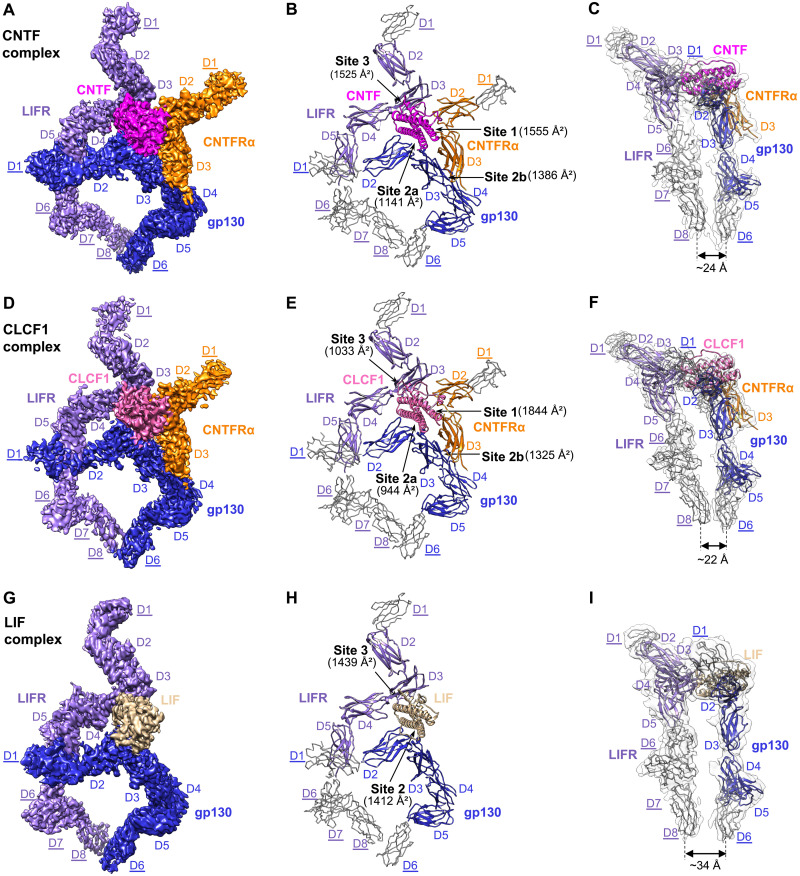
Fig. 1. Cryo-EM structures of the CNTF complex, CLCF1 complex, and LIF complex.
(A to C) The CNTF signaling complex is shown in three representations: colored cryo-EM density map (A), cartoon representation of the model containing full ECDs (B), and side view of the model in the transparent EM density map, low-pass filtered to better show density in the peripheral domains (C). (D to F) The CLCF1 signaling complex is shown similarly to (A) to (C). (G to I) The LIF signaling complex is shown similarly to (A) to (C). Models for receptor peripheral domains (gp130 D1 and D6, LIFR D1 and D6 to D8, and CNTFRα D1) that were only rigid-body fitted into the density to show the positions of these domains are colored gray and depicted as C-alpha ribbon traces. The corresponding labels are underlined [these domains are not included in Protein Data Bank (PDB) depositions]. The interaction interfaces with corresponding buried surface areas calculated by PDBePISA are indicated by arrows in (B), (E), and (H). Approximate distances between the bottom centers of LIFR and gp130 juxtamembrane domains in each complex are shown in (C), (F), and (I).

