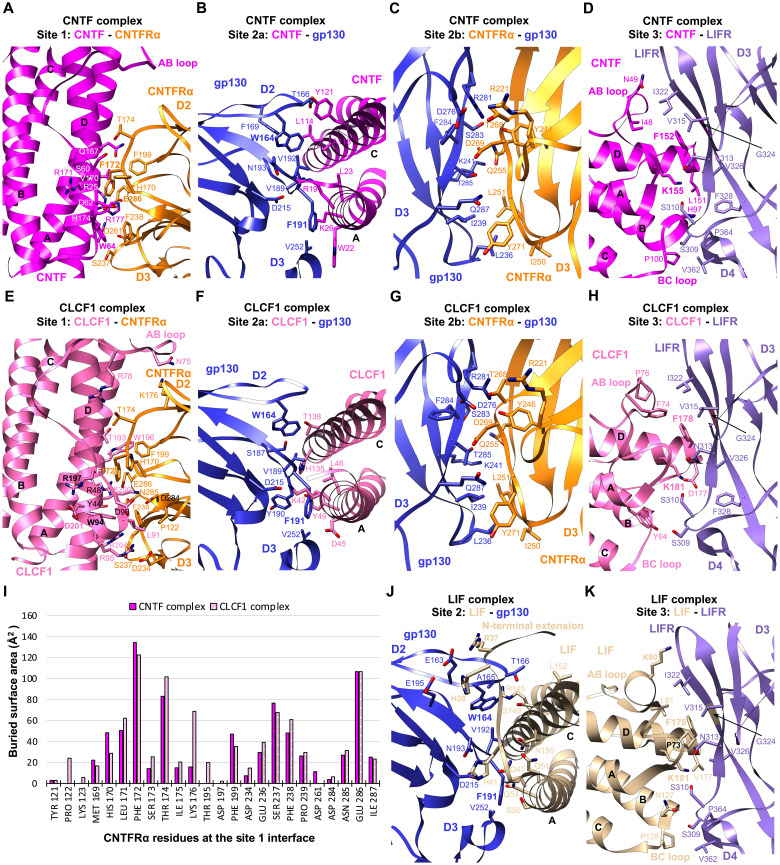
Fig. 2. Interaction interfaces of the CNTF complex, CLCF1 complex, and LIF complex.
(A to D) The binding interfaces of the CNTF complex at site 1 (A), site 2a (B), site 2b (C), and site 3 (D), as indicated in Fig. 1B, are shown in cartoon form, with residues involved in binding shown in stick representation. All-atom real space–refined model of the CNTF complex interaction core region (CNTF, CNTFRα D2D3, gp130 D2 to D5, and LIFR D2 to D5) was used for the analysis. (E to H) The CLCF1 complex binding interfaces at site 1 (E), site 2a (F), site 2b (G), and site 3 (H), as indicated in Fig. 1E, are shown in the same representation as (A) to (D). All-atom real space–refined model of the CLCF1 complex interaction core region (CLCF1, CNTFRα D2D3, gp130 D2 to D5, and LIFR D2 to D5) was used for the analysis. (I) Histogram of buried surface area for CNTFRα residues at the site 1 interface in the CNTF and CLCF1 signaling complexes. (J and K) Details of the LIF complex binding interfaces at site 2 (J) and site 3 (K) as indicated in Fig. 1H. All-atom real space–refined model of the LIF complex interaction core region (LIF, gp130 D2 to D5, and LIFR D2 to D5) was used for the analysis.

