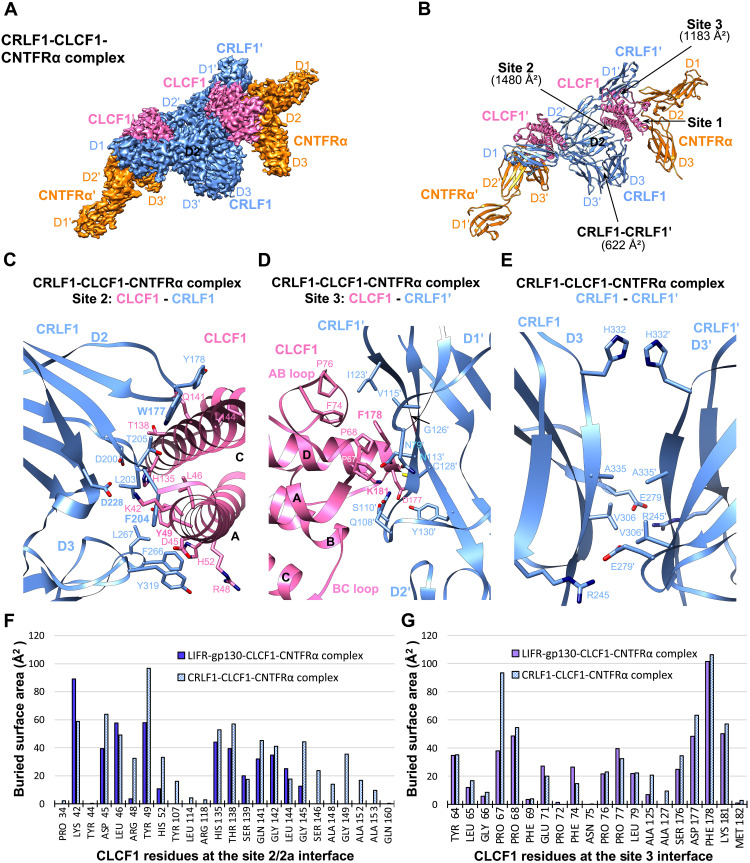
Fig. 3. Cryo-EM structure of the CRLF1-CLCF1-CNTFRα complex.
(A) Cryo-EM density map of the CRLF1-CLCF1-CNTFRα complex. The two sets of molecules in the hexameric complex are annotated as CRLF1, CLCF1, CNTFRα, CRLF1′, CLCF1′, and CNTFRα′. (B) Cartoon representation of the CRLF1-CLCF1-CNTFRα complex. Site 2 and site 3 interfaces and the CRLF1 dimer interface with corresponding buried surface areas calculated by PDBePISA are indicated by arrows. (C to E) Details of binding interfaces at site 2 (C), site 3 (D), and the CRLF1 dimer interface (E), as indicated in (B). (F and G) Histograms of buried surface area for CLCF1 residues at site 2/2a (F) and site 3 (G) interfaces in the LIFR-gp130-CLCF1-CNTFRα complex (CLCF1 signaling complex) and the CRLF1-CLCF1-CNTFRα complex.

