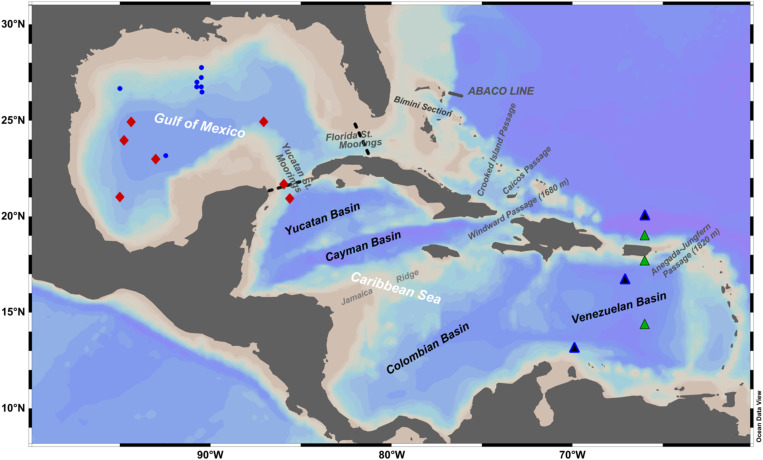
Fig. 1. Radiocarbon sampling locations during the 2017 CIGoM program (red diamonds).
Also included are existing data from the GoM [blue dots; (20, 28, 29)] and from the WOCE and CLIVAR section A22 [green triangles; (74); black triangles; (56)]. Approximate positions of mooring arrays are indicated with black dotted lines.

