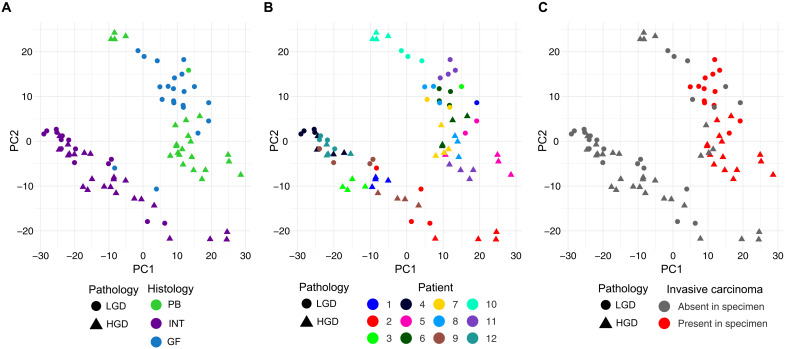
Fig. 2. Principal components analysis of normalized spatial RNA profiles.
Scatterplot of the first two principal components (PC1 and PC2). The shape of AOIs reflects the grade of dysplasia. (A to C) AOIs colored by (A) histologic subtype, (B) patient/slide ID, and (C) presence of carcinoma elsewhere in the specimen.

