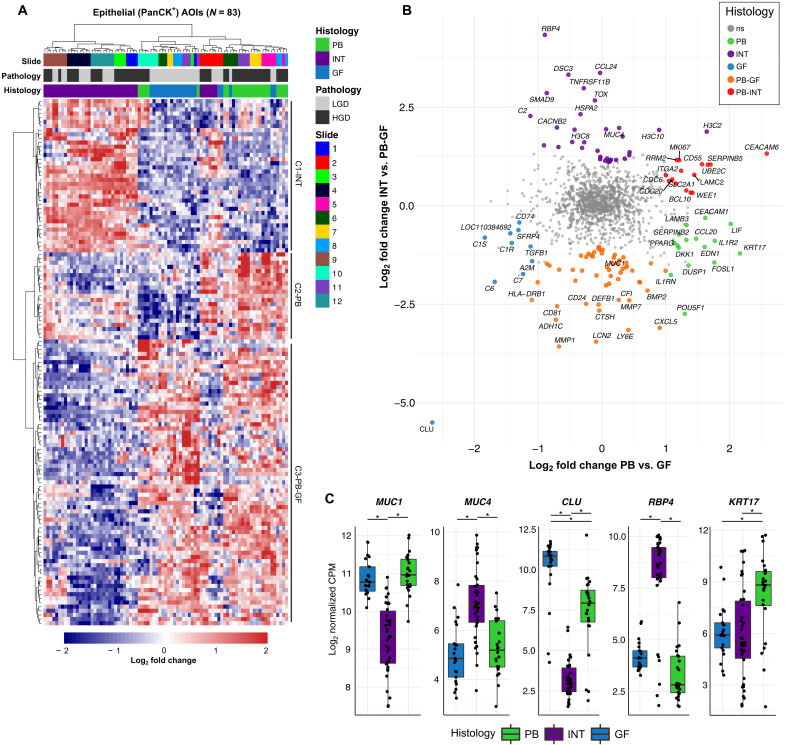
Fig. 3. Analysis of epithelial subtypes of IPMN.
(A) Heatmap plot of differentially expressed genes specific to PB, INT, and GF subtype [absolute log2 fold change > 1, adjusted P value (Padj) < 0.05]. Columns represent individual AOIs annotated by slide identifier, grade of dysplasia, and epithelial subtype. Rows represent individual genes with expression values scaled by z score. Hierarchical clustering of both columns and rows was performed. (B) Scatterplot showing log2 fold change of PB versus GF genes (x axis) and INT versus PB-GF (non-intestinal) (y axis). Genes that are significantly differentially expressed (absolute log2 fold change > 1, Padj < 0.05) are colored by the histologic subtype that they represent. The top 10 differentially expressed genes from each analysis are labeled. The widely used marker gene MUC1, which was overexpressed in PB-GF relative to INT, is labeled for reference. (C) Boxplots showing the log-normalized gene expression of subtype marker genes MUC1, MUC4, CLU, RBP4, and KRT17. *P < 0.05. PanCK+, pan-cytokeratin positive; ns, not significant; CPM, counts per million.

