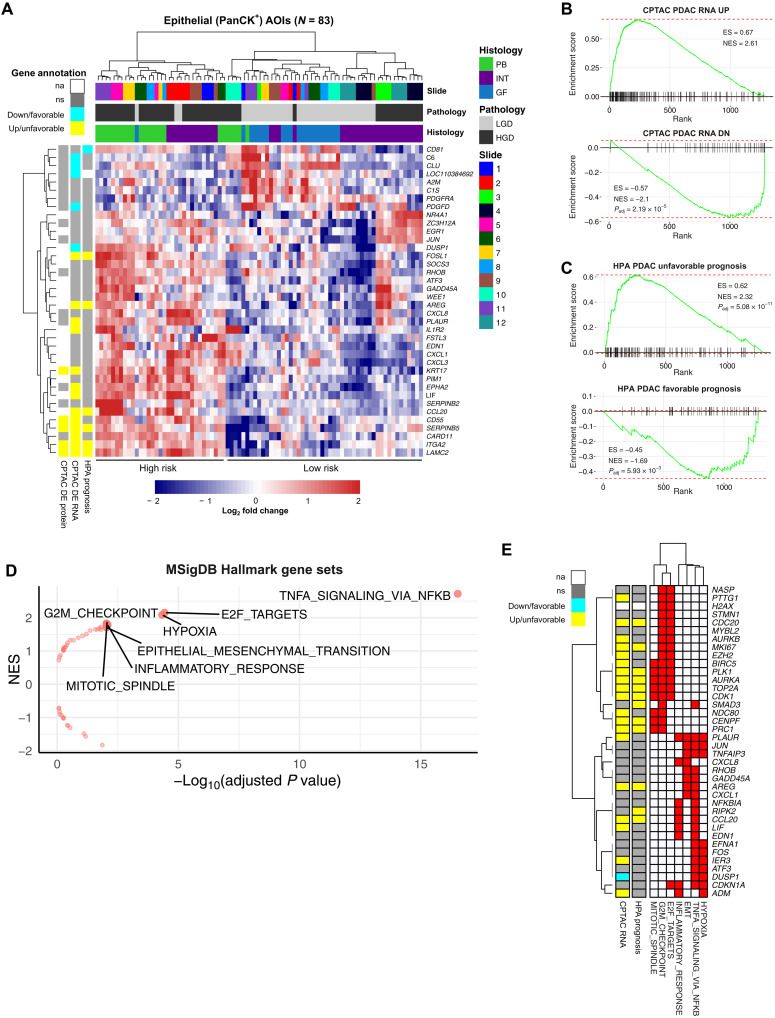
Fig. 4. Analysis by grade of dysplasia (HGD versus LGD).
(A) Heatmap plot of differentially expressed genes in AOIs representing HGD versus LGD (absolute log2 fold change > 1, Padj < 0.05). Gene expression values are scaled by z score. AOIs (columns) are annotated by slide identifier, grade of dysplasia, and epithelial subtype. High-risk and low-risk AOI clusters are annotated below. Genes (rows) are further annotated by established markers PDAC, including datasets from the Human Protein Atlas (HPA Prognosis) and Clinical Proteomic Tumor Analysis Consortium (CPTAC) analysis (CPTAC DE RNA and CPTAC DE protein). (B and C) Gene Set Enrichment Analysis (GSEA) enrichment plots using external PDAC gene sets comparing AOIs with HGD compared to LGD, ranked by log fold change. (D) Volcano plot of Molecular Signatures Database (MSigDB) Hallmark gene sets associated with HGD compared to LGD, with statistical significance plotted on the x axis and normalized enrichment score plotted on the y axis. Significantly enriched gene sets (Padj < 0.01) are shown with text labels. (E) Heatmap showing genes (rows) associated with two or more enriched Hallmark gene sets (columns). Rows are also annotated with evidence of dysregulation (CPTAC RNA) or prognostic relevance (HPA Prognosis) in PDAC.

