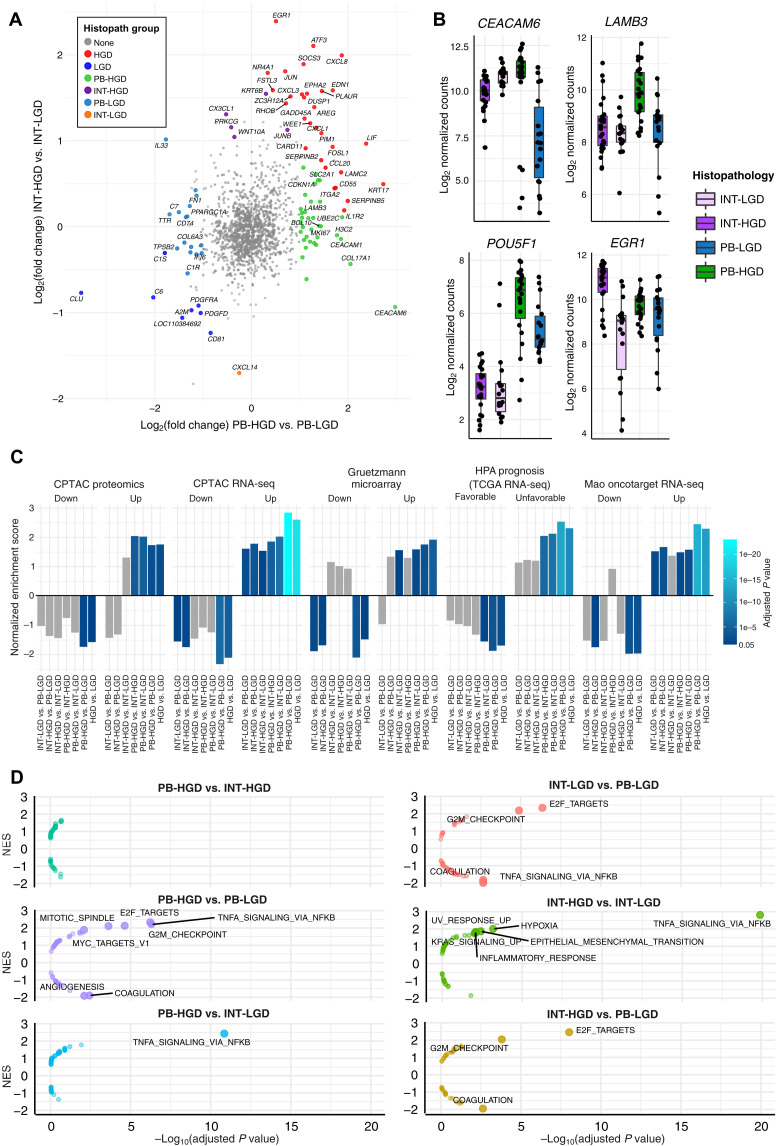
Fig. 5. Comparison of epithelial subtypes by grade of dysplasia.
(A) Scatterplot showing log2 fold change of PB-HGD versus PB-LGD (x axis) and INT-HGD versus INT-LGD (y axis). Significant DE genes are colored by histopathologic subgroup. Top 10 DE genes from each analysis are labeled. (B) Boxplots showing the log-normalized gene expression of histopathologic marker genes. (C) Barplots depicting GSEA normalized enrichment score obtained from testing of histopathologic groups against several external PDAC gene sets. Bar colors depict the Padj of each test. Gray bars are not statistically significant (Padj > 0.05). (D) Volcano plots of MSigDB Hallmark gene sets associated with each histopathologic subgroup (relative to its counterparts), with statistical significance plotted on the x axis and normalized enrichment score plotted on the y axis. Significant enrichment results (Padj < 0.01) are shown with text labels.

