. 2023 Mar 17;12:e83760. doi: 10.7554/eLife.83760

Figure 3. Loss of Ntn1 results in a significant reduction in excitatory postsynaptic current.

(A) Schematic of DAT-Cre dopamine specific Ntn1cKO. (B) Sample traces from control (top panel) and DAT Ntn1 cKO mice (bottom panel). (C–D) mEPSC amplitude (C) and frequency (D) measured from fluorescently identified dopamine neurons (n=35 controls, n=33 cKO, t=3.744, df = 66, ***p<0.001 and t=5.259, df = 66, ****p<0.0001). (E) Schematic of Vgat-Cre GABA specific Ntn1cKO. (F) Sample traces from control (top panel) and Vgat Ntn1 cKO mice (bottom panel). (G–H) mEPSC amplitude (G) and frequency (H) measured from fluorescently identified GABA neurons (n=30 controls, n=32 cKO, t=2.048, df = 60, *p<0.05, and t=3.966, df = 60, ***p<0.001). (I) Schematic of stimulating electrode placement in horizontal midbrain slice and example EPSCs. (J–K) Paired pulse ratio in dopamine (J, n=18 controls, n=21 cKO, t=1.271, df = 37, p>0.05), or GABA neurons (K, n=14 controls, n=21 cKO, t=1.105, df = 33, p>0.05).

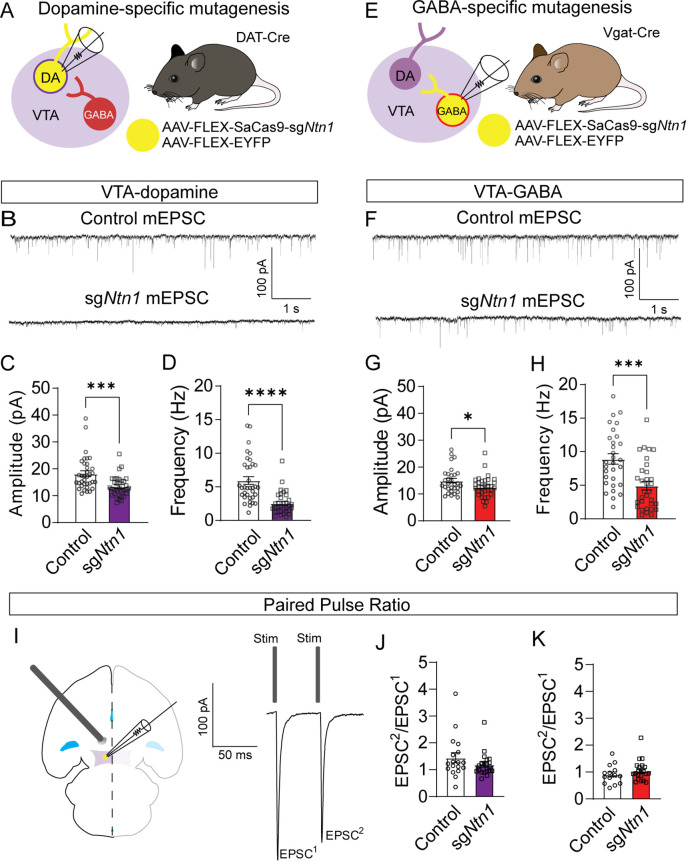
Figure 3—source data 1. EPSCs and IPSCs from targeted cells.
Figure 3—source data 2. Additional EPSC and IPSC data from non-targeted cells.

Figure 3.

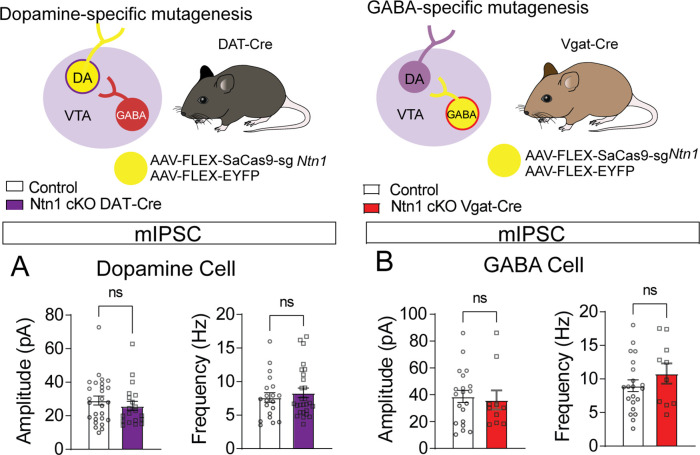
Figure 3—figure supplement 1. No significant differences in inhibitory synaptic connectivity associated with Ntn1 loss of function.

Figure 3—figure supplement 1.

(A) mIPSC amplitude and frequency of DAT-Cre fluorescently identified dopamine neurons (n=20 controls, n=27 cKO, t=0.8283, df = 45 p>0.05 and t=0.6668, df = 45 p>0.05). (B) mIPSC amplitude and frequency of Vgat-Cre fluorescently identified GABA neurons (n=20 controls, n=10 cKO, t=0.3183, df = 28 and t=1.106, df = 29 p>0.05).
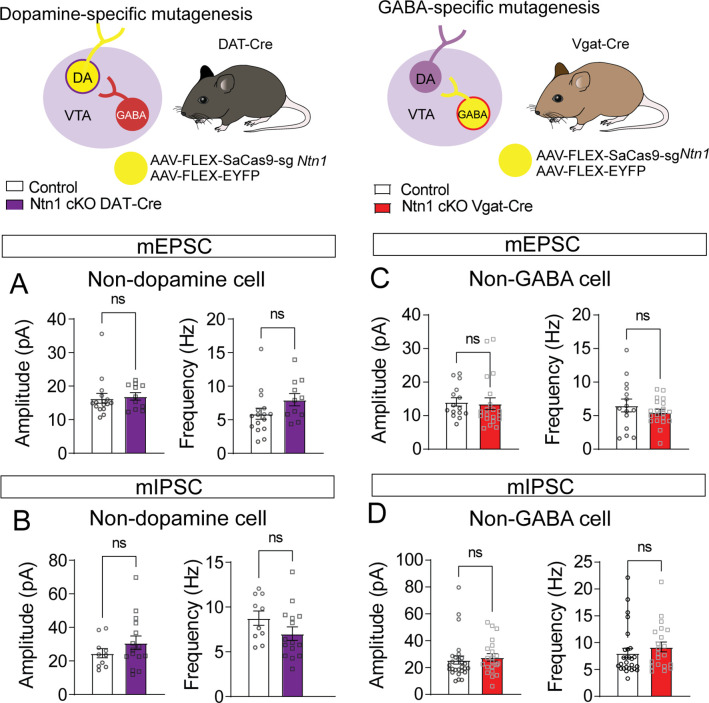
Figure 3—figure supplement 2. No significant differences in excitatory or inhibitory synaptic connectivity in non-targeted cell types.

Figure 3—figure supplement 2.

(A) Miniature excitatory postsynaptic current (mEPSC) amplitude and frequency recorded from non-fluorescent cells in DAT-Cre mice (presumptively non-dopamine neurons) (n=16 controls, n=11 cKO, t=0.2985, df = 25, and t=1.678, df = 25 p>0.05). (B) Miniature inhibitory postsynaptic current (mIPSC) amplitude and frequency recorded from non-fluorescent cells in DAT-Cre mice (n=10 controls, n=15 cKO, t=1.134, df = 23 and t=1.546, df = 23 p>0.05). (C) mEPSC amplitude and frequency recorded from non-fluorescent cells in Vgat-Cre mice (presumptively non-GABA neurons) (n=18 controls, n=20 cKO, t=0.2333, df = 33 and t=1.028, df = 33 p>0.05). (D) mIPSC amplitude and frequency recorded non-fluorescent cells in Vgat-Cre mice (n=27 controls, n=21 cKO, t=0.4650, df = 46 and t=0.8771, df = 46 p>0.05).
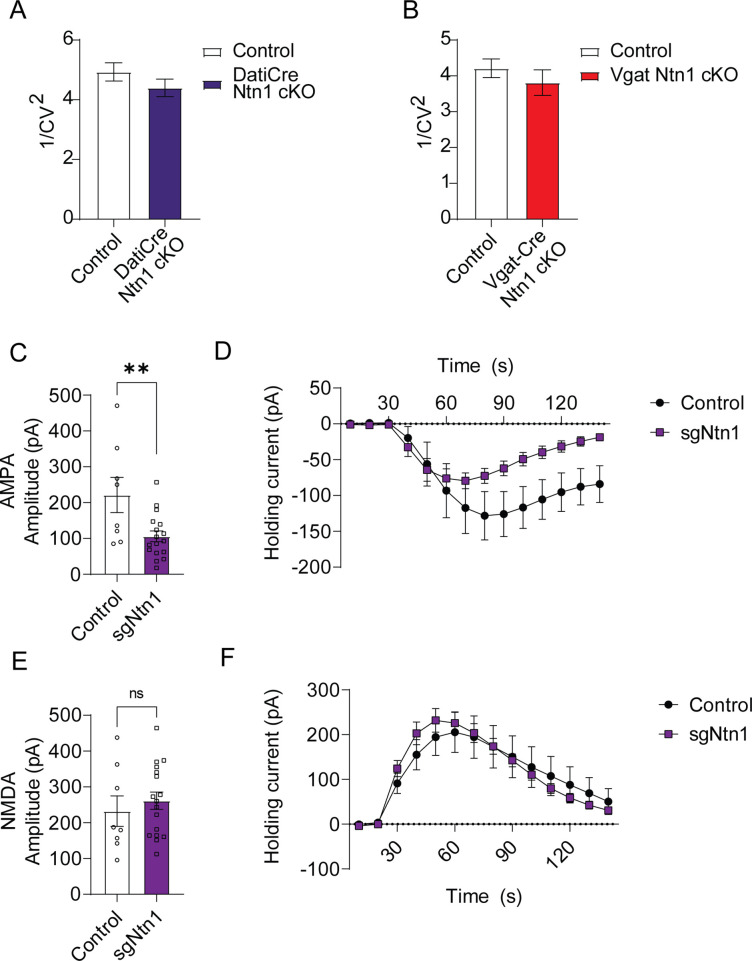
Figure 3—figure supplement 3. Loss of Netrin function results in significant decrease in AMPA response.

Figure 3—figure supplement 3.

Analysis of 1/CV2 from miniature excitatory postsynaptic current (mEPSC) data in (A) DAT-Cre mice measured from fluorescently identified dopamine neurons (n=35 controls, n=33 cKO, t=1.252, df = 66. p>0.05) and (B) Vgat-Cre mice measured from fluorescently identified GABA neurons (n=30 controls, n=32 cKO, t=0.8932, df = 60, p>0.05). (C) Bath application of 1 uM AMPA peak amplitude holding current (n=8 controls, n=17 sgNtn1, t=2.906, df = 23, p=0.008) and (D) voltage-clamped (–60 mV) holding current following 30 s bath application of 1 uM AMPA in 10 s averaged increments. (E) 50 uM NMDA evoked peak holding current (t=0.6421, df = 23, p=0.5271) and (F) voltage-clamped (+40 mV) holding current following 30 s bath application of 50 uM NMDA in 10 s averaged increments.