. 2023 Mar 8;12:e85739. doi: 10.7554/eLife.85739

Figure 1. Loss of Kindlin-1 leads to tumor clearance and immunological memory.

(A, C) Met-1 Kin1-WT, Kin1-NULL or Kin1-AA tumors were established via subcutaneous injection into flanks of CD1 nude mice (A) or FVB mice (C). Tumor growth was monitored and recorded until day 30, with average tumor growth shown. (B, D) Tumor size at day 10 post injection shown in CD1 nude mice (B) and FVB mice (D). (E) Left flank of FVB mice was injected with Met-1 Kin1-WT or Kin1-NULL cells. At day 35, when no tumor was present, Kin1-NULL injected mice were rechallenged with either Kin1-WT or Kin1-NULL Met-1 cells on the right flank. Naïve FVB mice were also injected concurrently. Tumor growth and survival (F) were monitored throughout. Combined data from three independent experiments (A–D). Example of two independent experiments (E–F). n=5–16 per group. Unpaired t-test (A–D) or Log Rank (F) with * =< 0.05, ** =< 0.01, *** =< 0.001. Analysis of human cell line MDA-MB-231 is shown in Figure 1—figure supplement 1, with proliferation analysis of tumours shown in Figure 1—figure supplement 2.

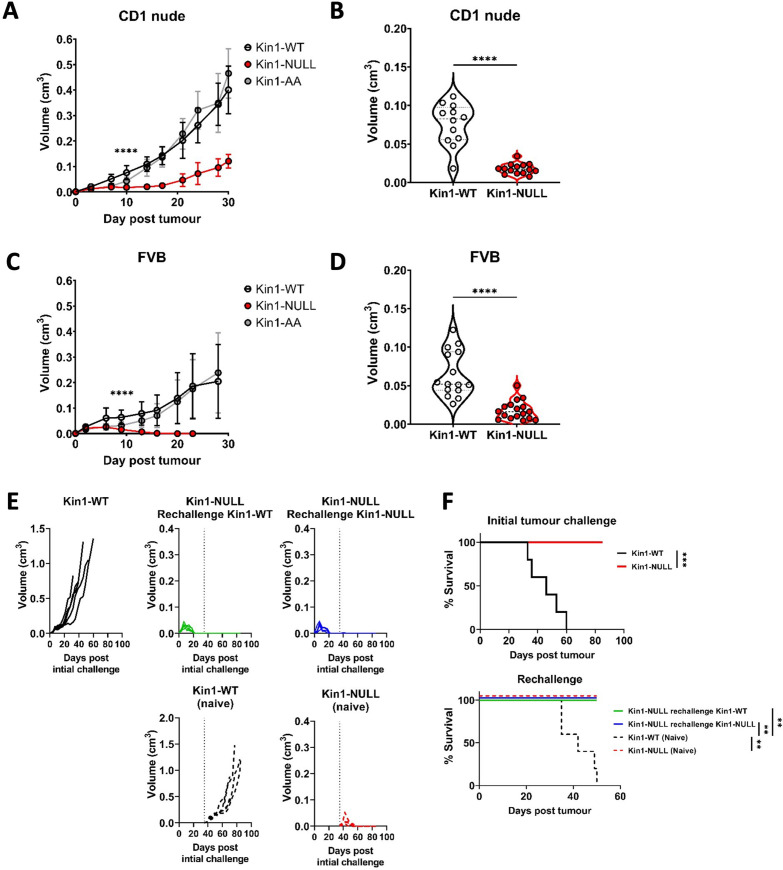
Figure 1.

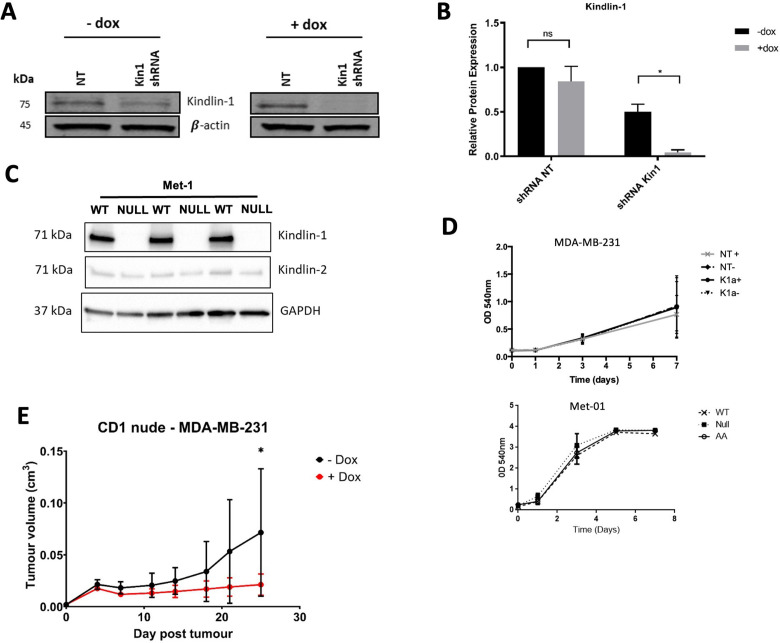
Figure 1—figure supplement 1. Loss of Kindlin-1 leads to reduction of tumor growth in human breast cancer model.

Figure 1—figure supplement 1.

(A) Representative western blot demonstrating Kindlin-1 protein knockdown after addition of doxycycline to MDA-MB-231 cells expressing inducible non-targeting (NT) or FERMT1 shRNA. (B) Quantification of A normalised to loading control, n=3 per group, error bars = SEM. (C) Western blot demonstrating Kindlin-1 deletion in Met-1 cells. (D) Loss of Kindlin-1 has no effect on in vitro proliferation of MDA-MB-231 (NT shRNA) and FERMT1 shRNA (K1a), or Met-1 cells, n=3 per group, error bars = SEM. (E) MDA-MB-231 cells carrying doxycycline inducible FERMT1 shRNA were subcutaneously injected into CD1 nude mice, after which doxycycline treatment was commenced for half the group. Tumor growth was monitored and recorded until day 25, with average tumor growth shown. n = 8 mice per group, error bars = SD. Unpaired t-test with * =< 0.05.
Figure 1—figure supplement 1—source data 1. Raw western blot images for Figure 1—figure supplement 1A, C.
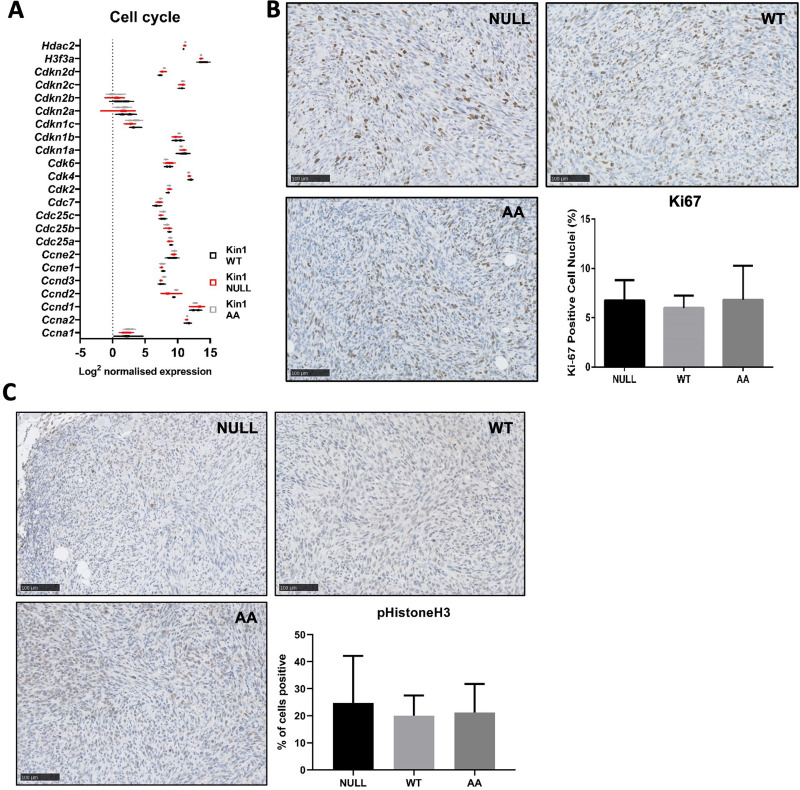
Figure 1—figure supplement 2. Loss of Kindlin-1 does not alter proliferation rate of Met-1 cells and tumors.

Figure 1—figure supplement 2.

(A) Nanostring PanCancer panel of cell cycle genes in Met-1 cells. n=3 per group. (B, C) Immunohistochemical analysis of Ki67 (B) and phospho-histone H3 (C) in Met-1 tumors, with representative images and quantification shown. n=3 per group, error bars = SD (BC).
Figure 1—figure supplement 2—source data 1. Nanostring PanCancer panel analysis of Met-1 Kin1-WT and NULL cells in vitro.