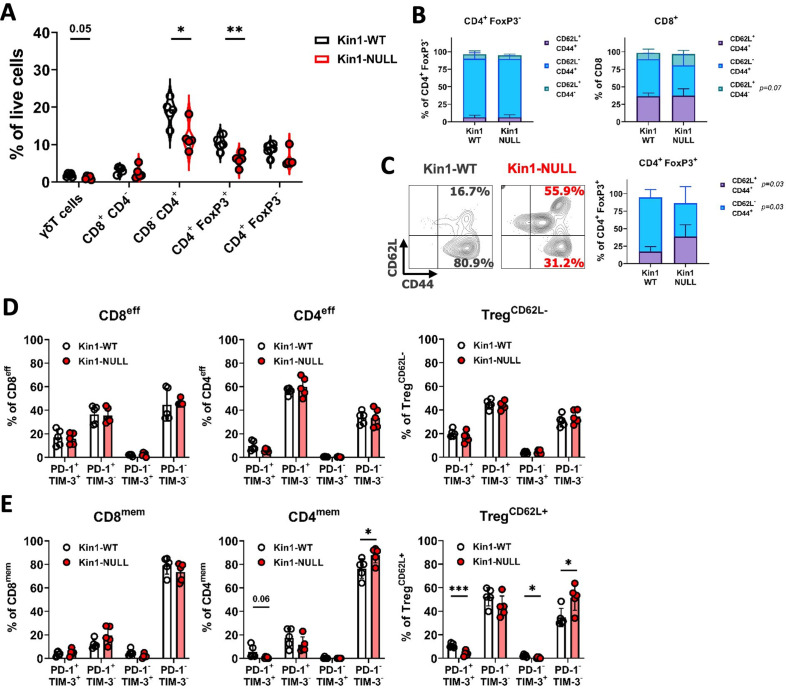
Figure 3. Loss of Kindlin-1 reduces tumor infiltrating Treg cells.
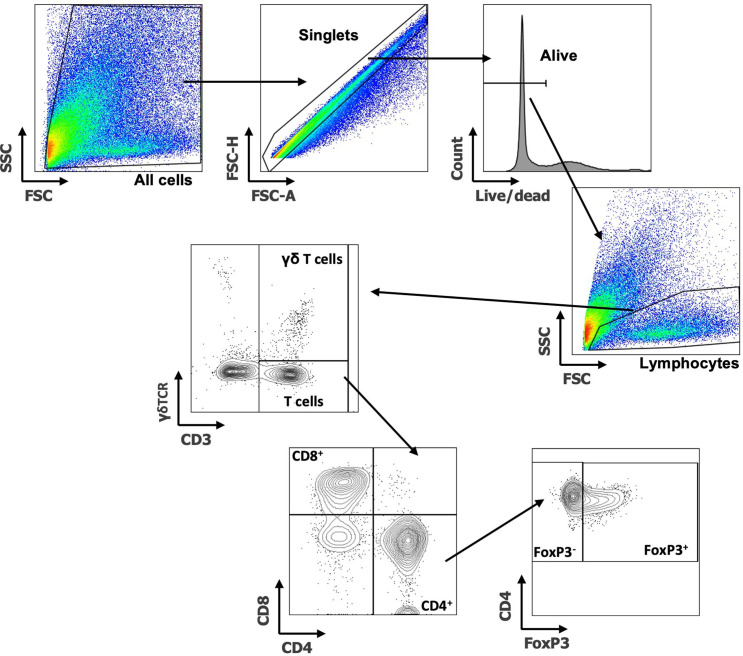
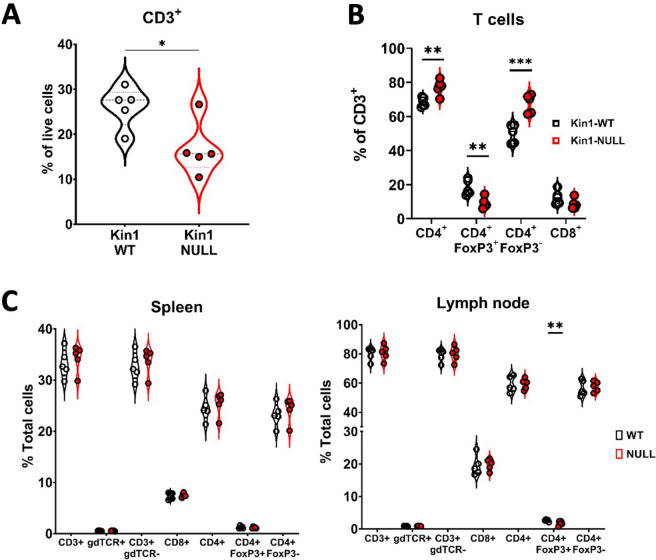
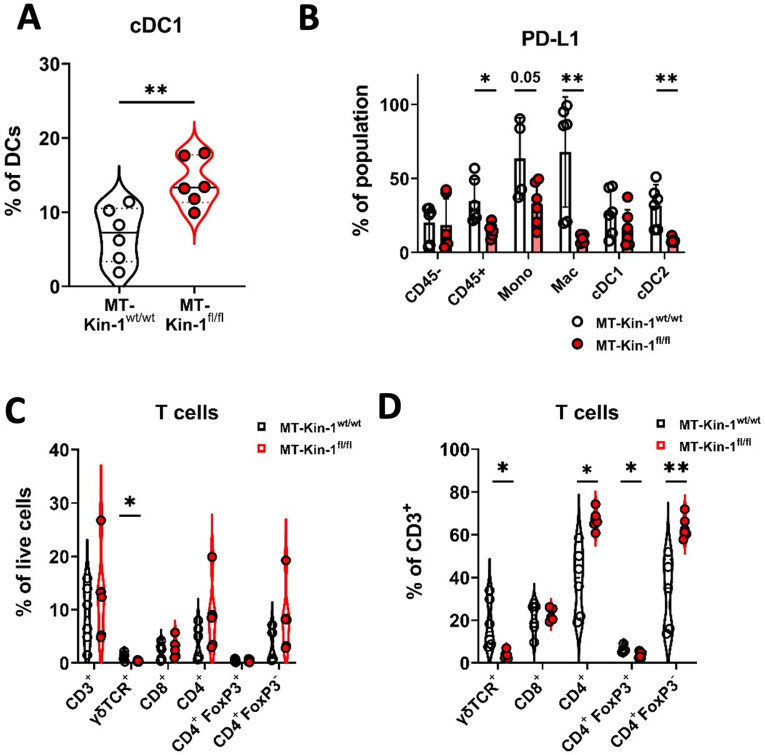
(A) Met-1 Kin1-WT or Kin1-NULL tumors were established via subcutaneous injection in FVB mice, and harvested at day 10 for immunophenotyping by flow cytometry. Gating of major T cell populations was conducted and quantified as percentage of total (alive) cells. Gating provided and further population analysis in Figure 3—figure supplements 1 and 2. (B) Quantification of effector (CD62L- CD44+), memory (CD62L+ CD44+) and naive (CD62L+ CD44-) populations as a percentage of corresponding T cell subset. (C) Representative example of gating resting Tregs (CD62L+) and activated Tregs (CD62L-) in tumors, with quantification on the right. (D, E) Quantification of PD-1 and TIM-3 expression on T cell subset effector (or CD62L-) populations (D) and memory (or CD62L+) populations (E). Example of two independent experiments (A–E). n=3–5 per group, error bars = SD. Unpaired t-test with * =< 0.05, ** =< 0.01, *** =< 0.001. Similar analysis of MMTV-PyV tumors provided in Figure 3—figure supplement 3.


