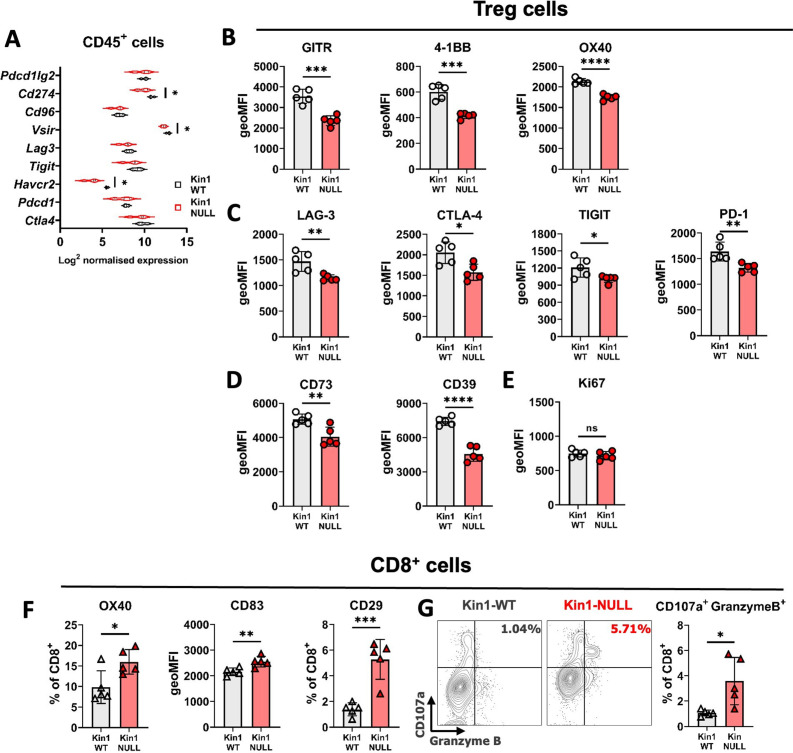
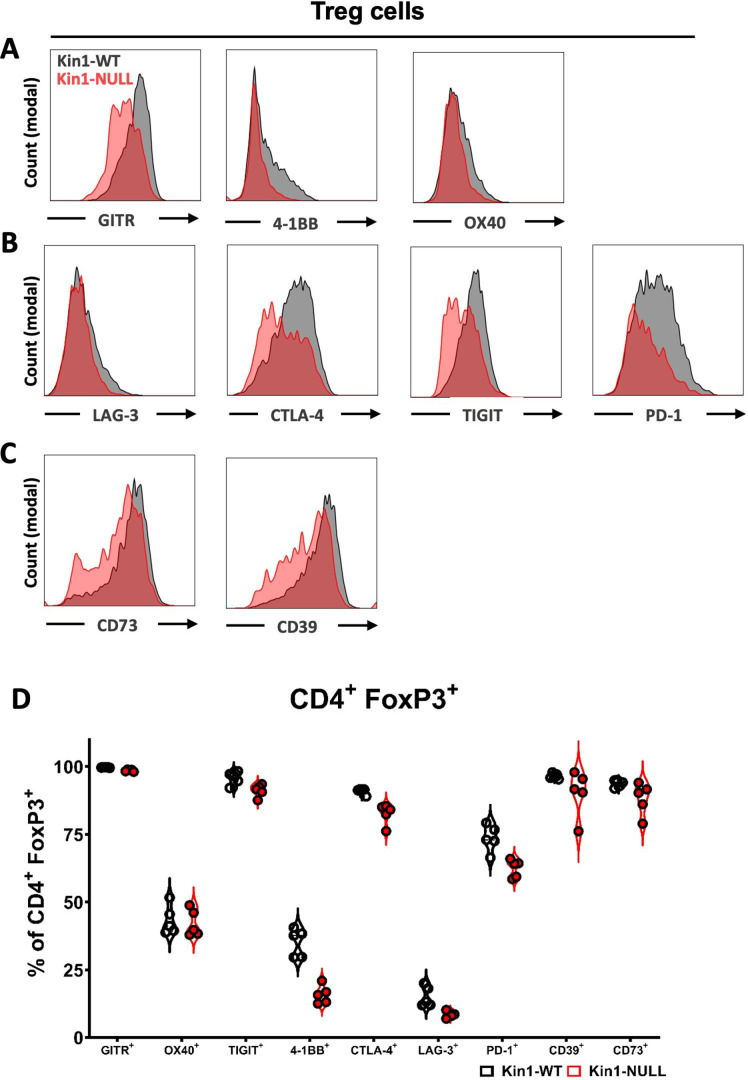
Figure 4. Loss of Kindlin-1 modulates Treg phenotype and function.
(A) Met-1 Kin1-WT or Kin1-NULL tumors were established via subcutaneous injection in FVB mice, and harvested at day 10 for RNA analysis of isolated CD45+ cells using Nanostring Immune Exhaustion panel. Shown is log2 normalised expression of known T cell inhibitory receptors and pathways. n = 3 per group. (B) As in A but tumors harvested for immunophenotyping by flow cytometry. Analysis of expression of markers were assessed on gated CD4+ FoxP3+ T cells (Tregs). Quantification of expression as geo mean fluorescent intensity (geoMFI) shown for TNF superfamily members (B), known inhibitory receptors (C), metabolism related receptors (D) and proliferation marker (E). Histograms and percentage expression is shown in Figure 4—figure supplement 1. (F) As in A with quantification of activation associated receptors on tumor infiltrating CD8+T cells. (G) Expression of markers of degranulation (CD107a) and cytotoxicity (Granzyme B) in tumor infiltrating CD8+ T cells. Example contour plots (left) and quantification of double positive cells (right). n=4–5 per group, error bars = SD. Unpaired t-test with * =< 0.05, ** =< 0.01, *** =< 0.001, **** =< 0.0001.


