. 2023 Mar 8;12:e85739. doi: 10.7554/eLife.85739

Figure 5. Loss of Kindlin-1 leads to altered cytokine secretion.

(A) Met-1 Kin1-WT or Kin1-NULL cells were cultured for 48 hr before conditioned media (CM) was harvested for analysis by forward phase protein array. Proteins detected above background are shown as fold change over Kin1-WT. Individual data points and Met-1 Kin1-AA are shown in Figure 5—figure supplement 2A. (B) Quantification of IL-6 in Met-1 conditioned media via ELISA. (C) Bulk tumor RNA analysis of Met-1 Kin1-WT or Kin1-NULL tumors at day 10. Log2 normalised expression of IL-6-related genes are shown. Expression of Cxcl13 genes is shown in Figure 5—figure supplement 2B. (D) As in C for Met-1 Kin1-WT or Kin1-NULL cells in vitro. n = 3-6 per group, error bars = SD. Unpaired t-test with *=<0.05, ** =< 0.01, *** =< 0.001, **** =< 0.0001. Expression of TGFβ signaling genes is shown in Figure 5—figure supplement 1, with quantification of B cells shown in Figure 5—figure supplement 3.

Figure 5—source data 1. Forward Phase Protein Array of Met-1 cells (raw values).
Figure 5—source data 2. Nanostring PanCancer Immune panel analysis of Met-1 Kin1-WT and NULL cells in vitro.

Figure 5.

Figure 5—figure supplement 1. Analysis of TGFβ signaling in Met-1 Kin1-WT, NULL tumors.

Figure 5—figure supplement 1.

(A) RNA analysis of TGFβ signalling related genes in Met-1 Kin1-WT and NULL cells in vitro, using Nanostring PanCancer immune profiling panel. (B) Met-1 Kin1-WT, NULL and AA tumors were established via subcutaneous injection in FVB mice, and harvested at day 10 for bulk tumour RNA analysis of TGFβ signalling related genes using Nanostring PanCancer immune profiling panel. (C) Immunohistochemistry analysis of phosphorylated SMAD3 in FFPE sections of Met-1 Kin-1 WT, NULL and AA tumours. n=3 biological replicates (A), n=4 mice per group (B), n=3-4 mice per group, error bars = SD (C). Unpaired t-test with * =< 0.05 and ** =< 0.01.
Figure 5—figure supplement 2. Quantification of CXCL13 and IL-6 in Met-1 Kin1-WT, Kin1-NULL and Kin1-AA cells.

Figure 5—figure supplement 2.

(A) Met-1 Kin1-WT, Kin1-NULL, and Kin1-AA cells were cultured for 48 hr before conditioned media (CM) was harvested for analysis by forward phase protein array. Data for CXCL13 and IL-6 from Figure 5 are presented here with individual data points and Met-1 Kin-1-WT, -NULL and -AA shown as fold change to WT. (B) RNA analysis of Met-1 Kin1-WT and Kin1-NULL cells in vitro. Log2 normalised expression of Cxcl13 and its receptor Cxcr5 are shown. n=3 biological replicates, error bars = SD. Unpaired t-test with * =< 0.05, ** =< 0.01, *** =< 0.001.
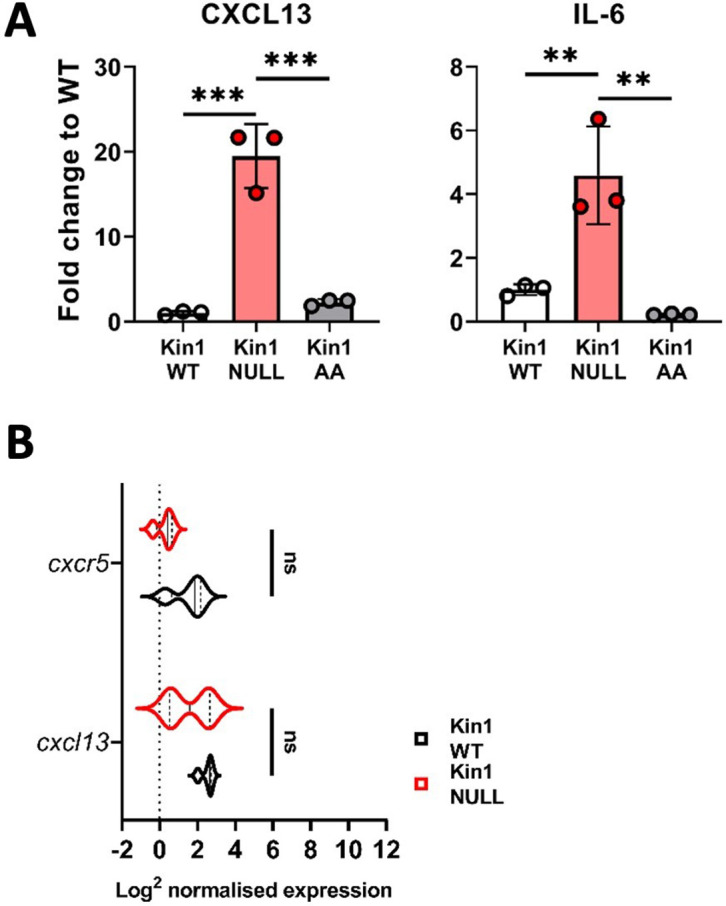
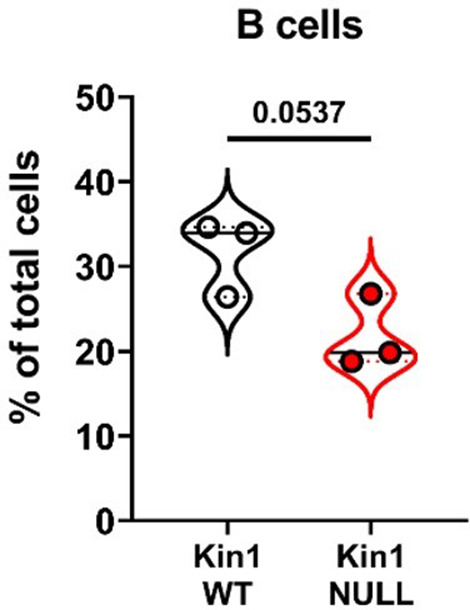
Figure 5—figure supplement 3. Quantification of B cells in Met-1 Kin1-WT and Kin1-NULL tumors.

Figure 5—figure supplement 3.

Met-1 Kin1-WT or Kin1-NULL tumors were established via subcutaneous injection in FVB mice, and harvested at day 10 for immunophenotyping by flow cytometry. Gating of CD3- cells was conducted with subsequent gating of B220+B cells as a percentage of total cells. n=3 per group. Unpaired t-test.