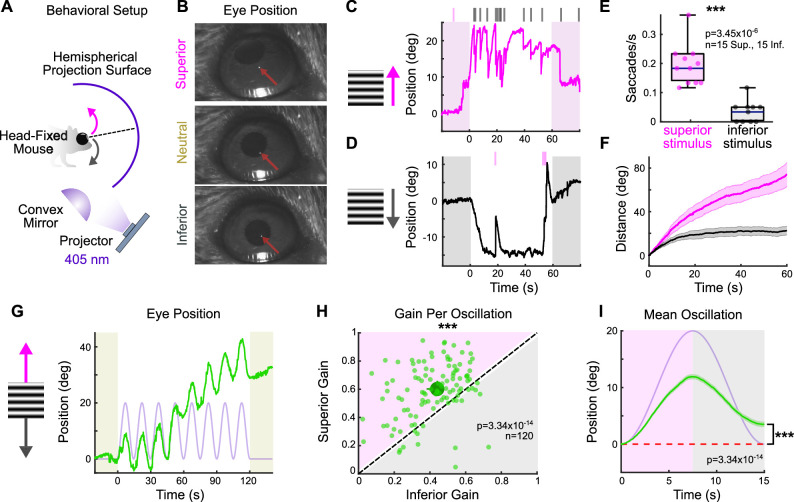
Figure 1. The superior and inferior optokinetic reflex (OKR) are asymmetric in adult mice.
(A) Schematic of behavioral setup to elicit the vertical OKR. The mouse is situated so that one eye is centered in a hemisphere. Stimuli are projected onto the hemisphere’s concave surface via reflection off of a convex mirror. Eye movements are tracked using an infrared-sensitive camera and a corneal reflection (see ‘Materials and methods’). (B) Example video frames demonstrating that the eye traverses between superior, neutral, and inferior positions in the presence of vertically drifting sinusoidal gratings. Red arrows mark the infrared corneal reflection. (C, D) Example of OKR in response to full contrast (C) superior and (D) inferior unidirectional drifting gratings (10°/s). For each epoch, a continuous 60 s stimulus was flanked by 20 s of a static grating (shaded regions). Ticks above the plots mark the time of fast nystagmus either in the superior (magenta) or inferior (gray) direction. Examples from one animal. (E) Rate of vertical fast nystagmus for superior and inferior stimuli on each epoch for N = 5 mice. Horizontal line represents median, box boundaries are the interquartile range (IQR), whiskers represent most extreme observation within 1.5× IQR. (F) Cumulative vertical distance traveled during slow nystagmus in response to superior (magenta) and inferior (gray) drifting gratings (mean ± SEM). (G) Example of OKR in response to a vertically oscillating sinusoidal grating. The eye position is shown in green, and the stimulus position is shown in lavender. Saccades (‘fast nystagmuses’) have been removed to reveal the asymmetry between superior and inferior OKR. For each epoch, animals viewed eight oscillation cycles lasting a total of 120 s, flanked by 20 s of a static grating (shaded regions). (H) Average gain of slow nystagmus during the superior versus inferior stage of individual oscillations. Each small dot is a single oscillation. The region of magenta (or gray) indicates that gain was greater for the superior (or inferior) stage of the oscillation. Points that fall on the line indicate equivalent gain for both stimulus directions. Large dot and whiskers represent univariate medians and 95% confidence intervals (via bootstrapping), respectively. Significance value indicates whether the points tend to fall unevenly on one side of the unity line (two-sided signed-rank). (I) Eye position (green) and stimulus position (lavender) averaged across all oscillations and all animals (mean ± SEM). Starting eye position is normalized to 0° at cycle onset. The average ending eye position is displaced in the superior direction (two-sided signed-rank). N = 5 mice for all experiments; n = number of trials. *p<0.05, **p<0.01, ***p<0.001.
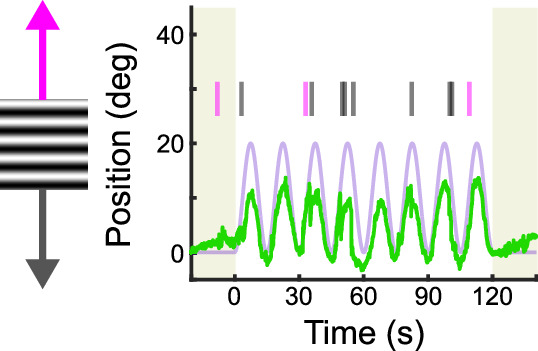
Figure 1—figure supplement 1. Example of sinusoidal vertical optokinetic reflex (OKR) before saccade removal.


