. 2023 Mar 17;12:e81780. doi: 10.7554/eLife.81780

Figure 2. Superior and Inferior ON direction-selective retinal ganglion cells (oDSGCs) have asymmetric spike tuning curves.

(A) Schematic illustrating unilateral bead injections into medial terminal nucleus (MTN) to retrogradely label ganglion cells in the contralateral retina. (B) Flat-mount retina with retrogradely labeled, MTN-projecting retinal ganglion cells. (C) Drifting bar stimulus (3.2° × limiting projector dimension, 10°/s, 2.4 × 10⁴ S-cone photoisomerization/s). (D) Definitions of superior (magenta) and inferior (gray) motion in visual space and on the retina. Directions are inverted by the lens. (E) Cell-attached spikes from labeled, MTN-projecting retinal ganglion cells in a flat-mount retina in response to a bar drifting in eight directions. Spike responses and average tuning curves from example Superior (left, magenta) and Inferior (right, gray) oDSGCs. Mean spike counts are presented as the distance from the origin, marked by concentric circles. Numbers on circles indicate spike counts. Dashed lines represent the preferred direction of each cell, calculated as the direction of the vector sum of all responses. Coordinates are in retinal space. (F, G) Population tuning curves across all Superior and Inferior oDSGCs (mean ± SEM). (F) Polar plots (as in [E]) aligned by rotating the tuning curves of Superior cells by 180°. (G) Linear representation of the same data (referred to as the ‘linear tuning curve’). CW: clockwise, nasal for Superior oDSGCs, temporal for Inferior oDSGCs; CCW: counterclockwise, temporal for Superior oDSGCs, nasal for Inferior oDSGCs. 0° represents directly superior/inferior motion. (H) Histograms of the area under the curve of the linear tuning curve of every cell. Inset shows the same metric for a stimulus at 20% relative contrast. (I) Population mean (± SEM) normalized tuning curves – computed by normalizing and aligning (at 0°) the response of each cell to its response in the preferred direction. (J) Histograms of the area under the curve of the normalized tuning curve (as in [I]) of every cell (referred to as ‘normalized area’). A larger normalized area indicates a wider tuning curve. Inset shows the same metric for a stimulus at 20% relative contrast. (K) Histograms of the direction selectivity index (DSI, vector sum, see ‘Materials and methods’) of every cell. Inset shows the same metric for a stimulus at 20% relative contrast. (L) Linear tuning curve area (as in [H]) and direction selectivity index (as in [K]) were correlated on a cell-by-cell basis for both Superior and Inferior oDSGCs. Dashed lines are least squares linear regressions, R and p values are Spearman’s rank correlation coefficient and associated two-sided significance value, respectively. For all histograms, medians of Superior (magenta) and Inferior (gray) oDSGC distributions are indicated by arrows. *p<0.05, **p<0.01, ***p<0.001.

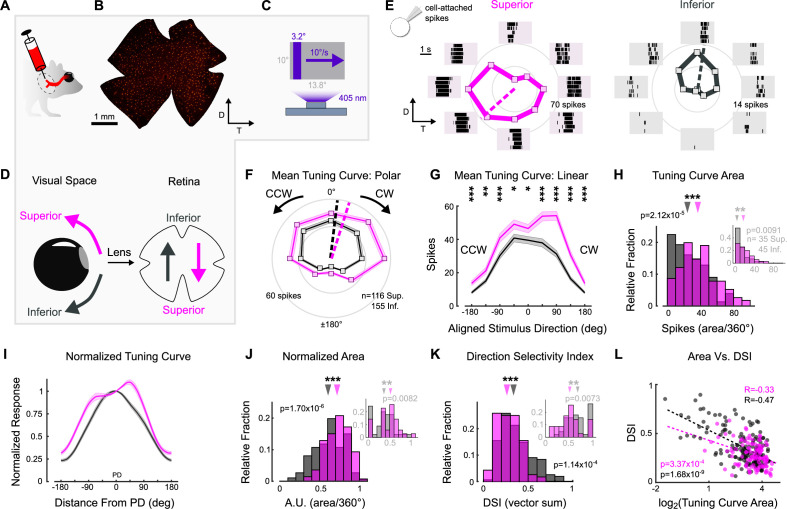
Figure 2.

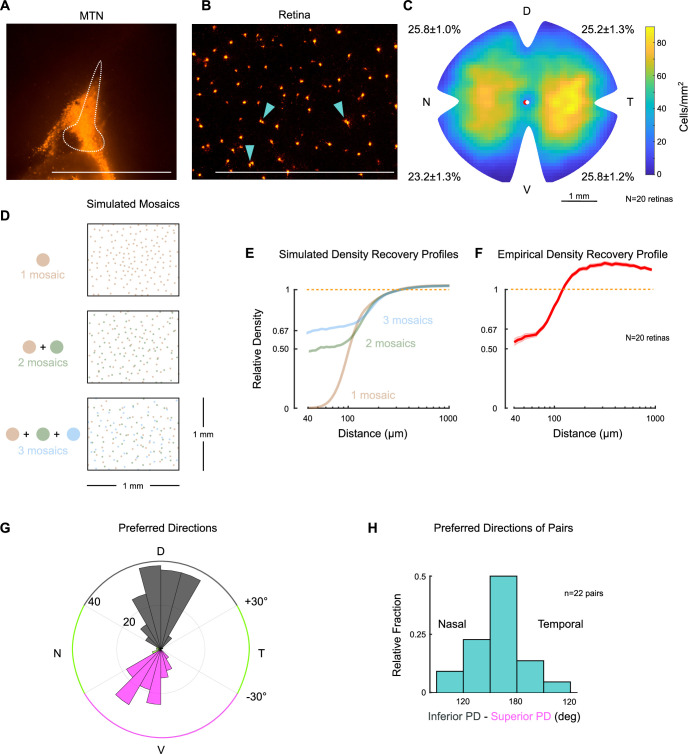
Figure 2—figure supplement 1. Two retinal ganglion cell types project to the medial terminal nucleus.

Figure 2—figure supplement 1.

(A) Sagittal section of medial terminal nucleus (MTN) following injection of fluorescent retrobeads (scale bar = 1mm). Dotted line outlines MTN. (B) Retrogradely labeled retinal ganglion cell somas in a flat-mount retina after contralateral MTN injection. Arrowheads point to examples where labeled cells form ‘pairs’ (i.e., are within 30 µm of each other; scale bar = 1 mm), as described previously (Yonehara et al., 2008). (C) Density heatmap of retrogradely labeled MTN-projecting retinal ganglion cells across the contralateral retina. Numbers around the perimeter indicate the percentage of cells found in each quadrant (mean ± SEM). D, T, V, and N denote dorsal, temporal, ventral, and nasal directions, respectively, on the retina. Pairwise comparisons of the average number of cells per quadrant did not reveal any significant differences. However, comparing across halves showed that densities were marginally greater in dorsal compared to ventral retina (p=0.047), and in temporal compared to nasal retina (p=0.021). (D) Simulations of retinal ganglion cell populations that consist of one (top), two (middle), and three (bottom) mosaics. Each simulation contains approximately the same number of total cells. When only one mosaic is present (top), cells obey exclusion zones and do not cluster next to each other. When more than one mosaic is present, cells do not respect the exclusion zones of other cell types and ‘pairs’ (middle) and ‘trios’ (bottom) begin to form. Retinal ganglion cells of distinct types are well known to tile the retina in separate mosaics. (E) Mean density recovery profiles (DRPs) for simulated retinal ganglion cell populations of one (tan), two (green), and three (blue) mosaics (n = 30 repetitions each). Only single mosaics exhibit a complete exclusion zone. The DRP of two mosaics converges to 50% of its average density (dashed line) as distance approaches 0, and the DRP of three mosaics converges to 67% of its average density. More generally, a spatial distribution of ganglion cells will converge to n-1n×100% of its average density, where n is the total number of mosaics (Cook and Podugolnikova, 2001). (F) DRP measured from retrogradely labeled MTN-projecting retinal ganglion cells (mean ± SEM). The empirical DRP lacks a full exclusion zone and converges to ~50% of its average density (1.0), indicating that there are likely two ganglion cell types, each forming an independent mosaic. Note that the DRP overshoots 1.0 within the shown domain because ON direction-selective retinal ganglion cells (oDSGCs) are not uniformly distributed across the retina (as shown in [C]).Normalizing to the peak density yields similar results. (G) Polar histogram of preferred directions measured in cell-attached mode across retrogradely labeled retinal ganglion cells identified by epifluorescence targeting. Colored segments of the outer circle indicate preferred direction thresholds for classification of Superior (magenta), Inferior (gray), and other direction-selective retinal ganglion cells (green). Coordinates are in retinal space. Concentric circles indicate the number of cells per bin. Labeled retinal ganglion cells divide into two major physiological types: superior-preferring and inferior-preferring. Only a small fraction of cells prefer horizontal directions (green). (H) Preferred directions of retrogradely labeled cells found in pairs (somas within 30 µm of each other). Paired cells tend to prefer opposite directions of motion (180° apart), further indicating that (1) two separate populations of ganglion cells project to MTN and (2) each population forms an independent mosaic.
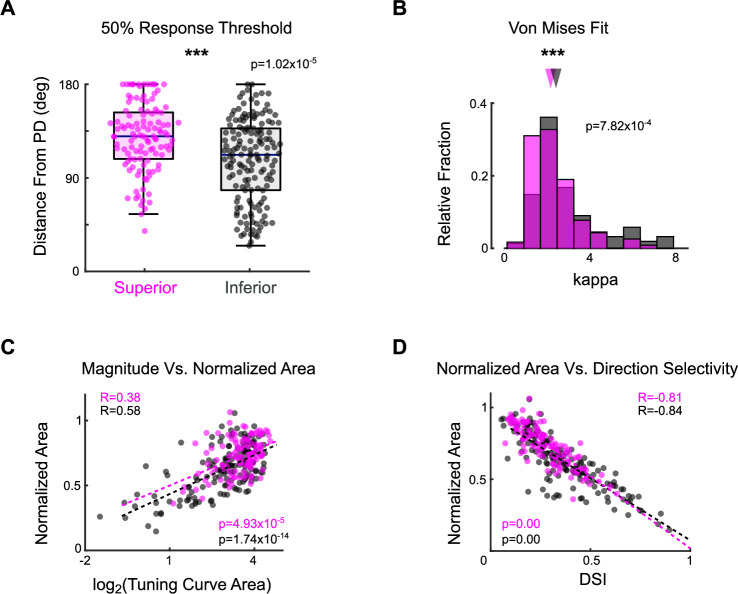
Figure 2—figure supplement 2. Additional metrics of ON direction-selective retinal ganglion cell (oDSGC) spike tuning curve width.

Figure 2—figure supplement 2.

(A) Distributions of the distance (in degrees) from each cell’s preferred direction to the point at which its response magnitude first drops below 50% of the response in the preferred direction. Larger values indicate a wider tuning curve. Horizontal line represents median, box boundaries are the IQR, and whiskers represent most extreme observation within 1.5× IQR. Points represent individual cells. (B) Histograms of the kappa parameter for the Von Mises fit of the tuning curve of each cell (see ‘Materials and methods’). A smaller kappa value indicates a wider tuning curve. (C) The area of the linear tuning curve and the area of the normalized tuning curve were positively correlated on a cell-by-cell basis. (D) The direction selectivity index and the area of the normalized tuning curve were negatively correlated on a cell-by-cell basis. Dashed lines in (C) and (D) are least-squares linear regressions for Superior (magenta) and Inferior (gray) oDSGCs. R and p values are the Spearman’s rank correlation coefficient and associated two-sided significance, respectively. *p<0.05, **p<0.01, ***p<0.001.
Figure 2—figure supplement 3. Asymmetries between Superior and Inferior ON direction-selective retinal ganglion cells (oDSGCs) persist under two-photon targeting.

Figure 2—figure supplement 3.

Retrogradely labeled oDSGCs were targeted for cell-attached recordings using a two-photon laser (860 nm). Spikes were measured from Superior and Inferior oDSGCs in response to the drifting bar stimulus. Under two-photon conditions, Superior oDSGCs had (A) greater area of the linear tuning curve, (B) lower direction selectivity indices, and (C) greater area of the normalized tuning curve compared to Inferior oDSGCs. (D) Direction selectivity and tuning curve area were significantly correlated on a cell-by-cell basis for both Superior and Inferior oDSGCs. Dashed lines are least-squares linear regressions for Superior (magenta) and Inferior (gray) oDSGCs. R and p values are the Spearman’s rank correlation coefficient and associated two-sided significance, respectively. These findings confirm the results from experiments in which ganglion cells were targeted by epifluorescence (Figure 2, Figure 2—figure supplement 2). Cells in this two-photon dataset come from tissue that was never exposed to epifluorescence. No cell is in both the epifluorescence and two-photon datasets. *p<0.05, **p<0.01, ***p<0.001.
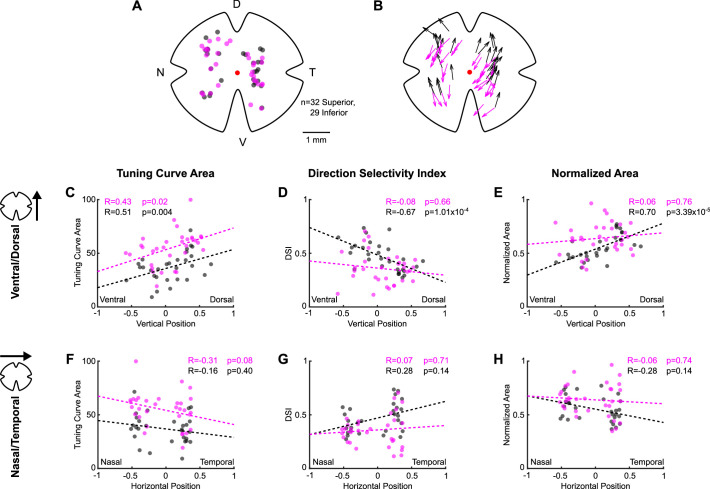
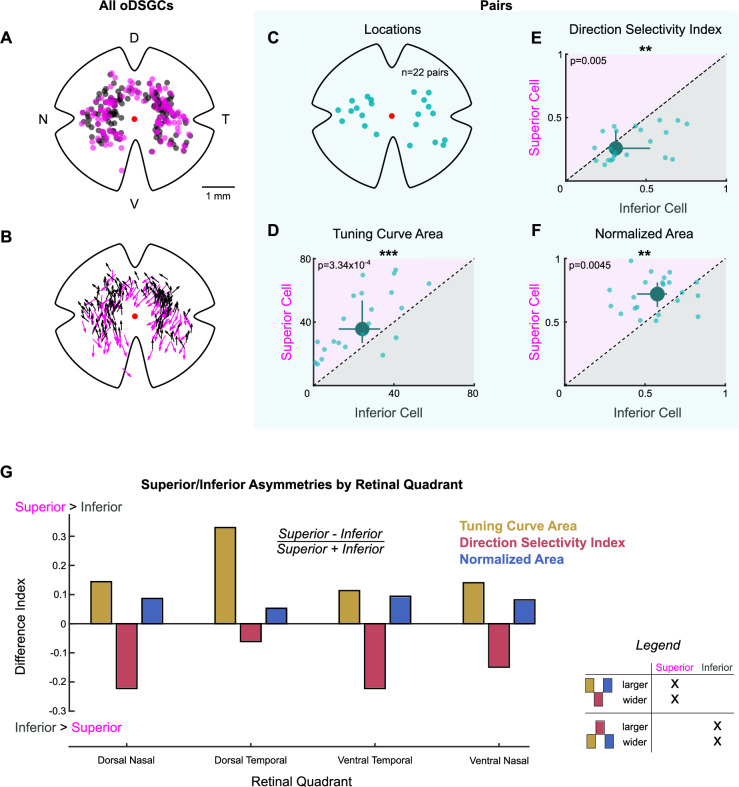
Figure 2—figure supplement 4. Physiological differences between Superior and Inferior ON direction-selective retinal ganglion cells (oDSGCs) are consistent across retinal topography.

Figure 2—figure supplement 4.

(A) Map of retinal locations of all medial terminal nucleus (MTN)-projecting retinal ganglion cells recorded during cell-attached experiments in which epifluorescence targeting was used. D, T, V, and N denote dorsal, temporal, ventral, and nasal directions, respectively, on the retina and apply to all maps. (B) Map of the preferred direction of each cell in (A). The arrow base marks the location of the cell soma. The arrowhead points in the preferred direction. Preferred directions varied systematically across the retina, as reported previously (Sabbah et al., 2017). (C–F) Data from Superior and Inferior oDSGCs that formed ‘pairs’ (i.e., somas within 30 µm of each other, see Figure 2—figure supplement 1). Pairwise comparisons in these cells remove potential confounds caused by differences in topographic distributions when looking for asymmetries across Superior and Inferior oDSGC populations. (C) Retinal location of each recorded pair. (D–F) Tuning curve metrics for the Superior and Inferior oDSGCs in each pair: (D) linear tuning curve area, (E) direction selectivity index, and (F) area of the normalized tuning curve. Dashed lines indicate unity. Large points represent the univariate medians. Whiskers are 95% confidence intervals for each median, determined via bootstrapping. Significance values indicate pairwise comparisons between Superior and Inferior oDSGCs (two-sided signed-rank). Superior oDSGCs spike more (D), are less direction-selective (E), and have wider tuning curves (F) when compared to the Inferior oDSGCs with which they form pairs. (G) Comparison of tuning curve metrics between Superior and Inferior oDSGCs found in each retinal quadrant. Bars show a difference index [(Superior - Inferior)/(Superior +Inferior)] calculated from the median linear tuning curve area (olive), direction selectivity index (red), or area of the normalized tuning curve (blue) per quadrant for each oDSGC type. Positive values indicate that the metric is greater for Superior cells in that quadrant and negative values indicate that the metric is greater for Inferior cells in that quadrant. Difference indices are bound between –1 and 1. Within each retinal quadrant, Superior oDSGCs have a larger linear tuning curve area, a lower direction selectivity index, and a larger normalized tuning curve area than Inferior oDSGCs. Data match the first possibility illustrated in the legend. *p<0.05, **p<0.01, ***p<0.001.
Figure 2—figure supplement 5. Topographic variation in direction tuning properties across the retina revealed by two-photon targeting.

Figure 2—figure supplement 5.

(A) Map of retinal locations of all medial terminal nucleus (MTN)-projecting retinal ganglion cells recorded during cell-attached experiments in which two-photon targeting was used. D, T, V, and N denote dorsal, temporal, ventral, and nasal directions, respectively, on the retina and apply to all maps. (B) Map of the preferred direction of each cell in (A). The arrow base marks the location of the cell soma. The arrowhead points in the preferred direction. Preferred directions varied systematically across the retina, as seen using epifluorescence targeting (Figure 2—figure supplement 4B) and as reported previously (Sabbah et al., 2017). (C–H) Scatter plots of tuning curve metrics as a function of each cell’s position along either the ventral-dorsal (C–E) or nasal-temporal (F–H) axis of the retina. Coordinates are normalized to the size of the retina from which each cell was recorded (normalized coordinates range between –1 and 1, see ‘Materials and methods’). Inferior ON direction-selective retinal ganglion cells (oDSGCs) change tuning curve size (C) and width (D, E) as a function of dorsal-ventral location, whereas only the tuning curve size (C) of Superior oDSGCs is modulated along the same axis. No metric is significantly related to position along the nasal-temporal axis for either cell type (F–H). Further, Superior oDSGCs tend to have larger and wider tuning curves than Inferior oDSGCs across all dimensions (separation between magenta and gray lines). For all scatter plots, dashed lines are least-squares linear regressions for Superior (magenta) and Inferior (gray) oDSGCs. R and p values are the Spearman’s rank correlation coefficient and associated two-tailed significance, respectively. Two-photon targeting was used for all data in this figure so as to avoid confounds associated with epifluorescence exposure and photoreceptor absorption spectra gradients across retinal topography.