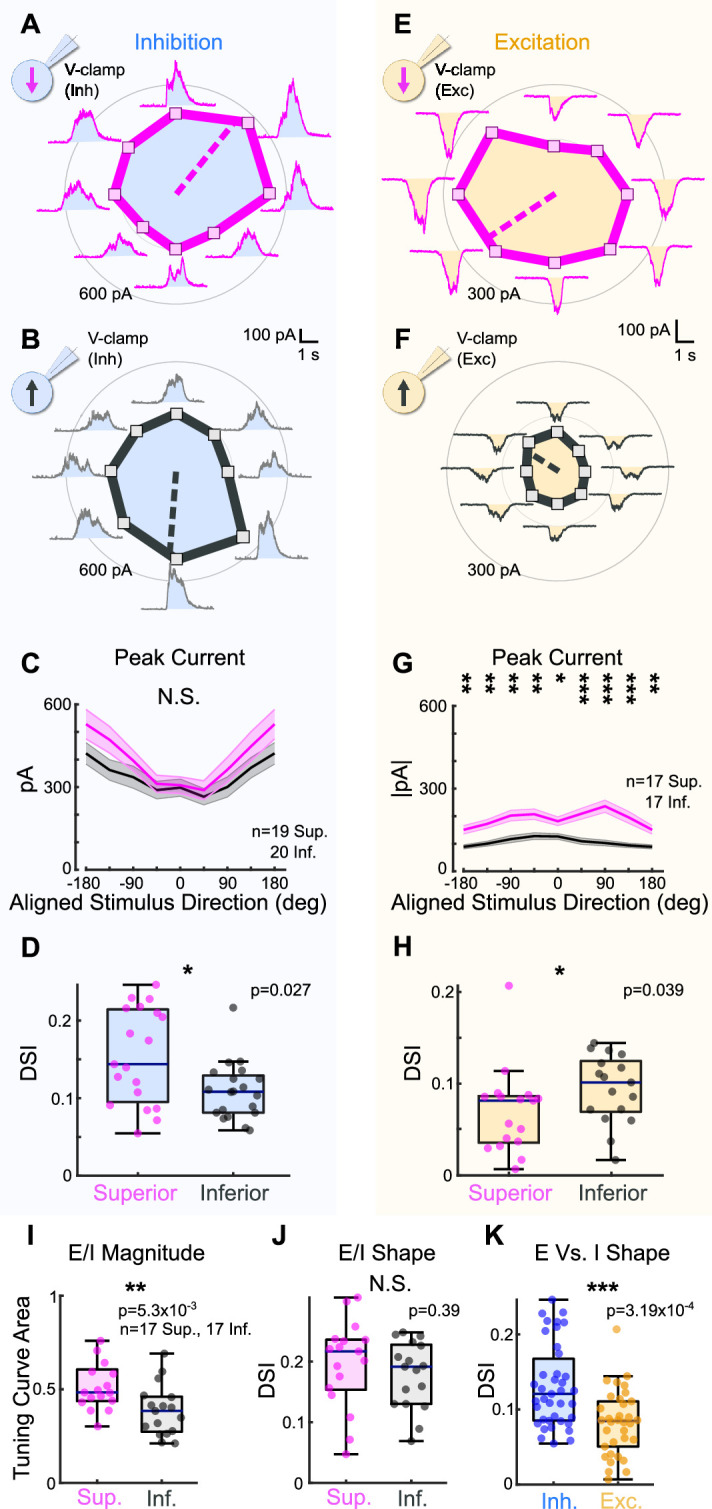
Figure 3. Superior ON direction-selective retinal ganglion cells (oDSGCs) receive similar inhibitory inputs but greater excitatory inputs compared to Inferior oDSGCs.
(A) Inhibitory currents measured from an exemplar Superior oDSGC under voltage-clamp at +10 mV in response to a bar drifting in eight directions. Mean peak inhibitory current is presented as the distance from the origin for each stimulus direction. Dashed line indicates the preferred direction of the peak inhibitory currents. Coordinates are in retinal space. (B) Same as (A) for an exemplar Inferior oDSGC. (C) Population responses for peak inhibitory currents across stimulus directions for Superior (magenta) and Inferior (gray) oDSGCs (mean ± SEM). Stimulus directions are aligned across cell types, where 0° indicates directly superior (for Superior oDSGCs) or inferior (for Inferior oDSGCs) motion. Positive directions are clockwise. (D) Distributions of the direction selectivity index for peak inhibitory currents in individual Superior and Inferior oDSGCs. (E) Excitatory currents measured from an exemplar Superior oDSGC under voltage-clamp at –60 mV in response to a bar drifting in eight directions. Same cell as in (A). (F) Same as (E) for an exemplar Inferior oDSGC. Same cell as in (B). (G) Population responses for peak excitatory currents across stimulus directions for Superior (magenta) and Inferior (gray) oDSGCs (mean ± SEM). (H) Distributions of the direction selectivity index for peak excitatory currents in individual Superior and Inferior oDSGCs. (I, J) The ratio of the peak excitatory current to the peak inhibitory current (E/I) was calculated for each stimulus direction for cells in which both metrics were recorded. (I) Distributions of the linear tuning curve area of E/I. (J) Distributions of the direction selectivity index for E/I. (K) Direction selectivity index for peak inhibitory (blue) and excitatory (yellow) currents collapsed across Superior and Inferior oDSGCs. For box plots, horizontal line represents median, box boundaries are IQR, and whiskers represent the most extreme observation within 1.5× IQR. *p<0.05, **p<0.01, ***p<0.001.


