. 2023 Mar 17;12:e81780. doi: 10.7554/eLife.81780

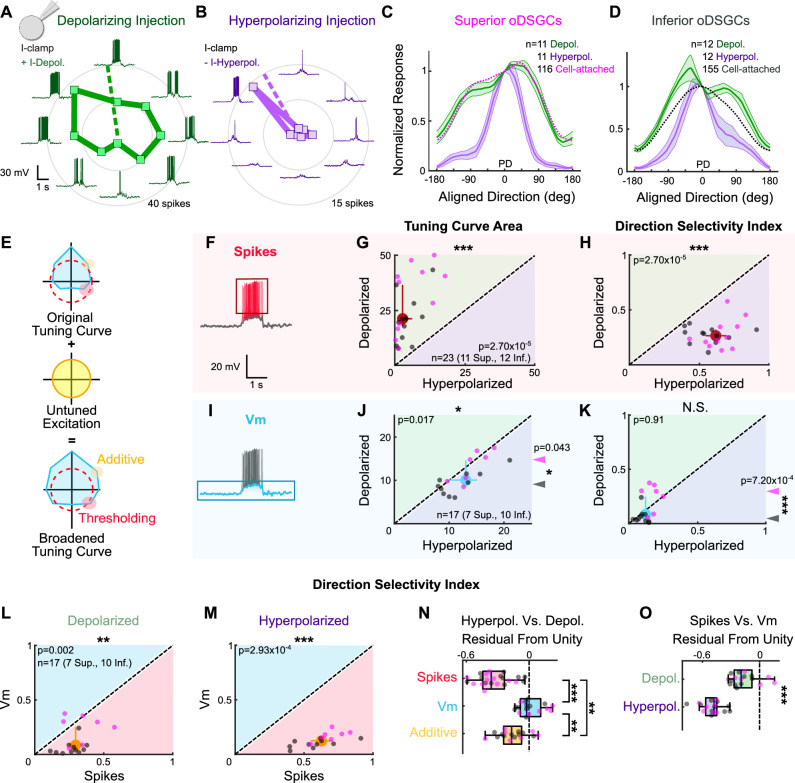
Figure 5. Thresholding differentiates the tuning properties of Superior and Inferior ON direction-selective retinal ganglion cells (oDSGCs).

(A, B) Exemplar Inferior oDSGC in whole-cell current-clamp during (A) depolarizing and (B) hyperpolarizing current injection in response to a bar moving in eight directions. Numbers on concentric circles indicate spike counts. Dashed lines represent preferred directions. Coordinates are in retinal space. (C, D) Mean (± SEM) normalized tuning curves (aligned and normalized to the response of each cell in its preferred direction) for (C) Superior and (D) Inferior oDSGCs under conditions of depolarizing (green) and hyperpolarizing (purple) current injection. Dotted lines indicate the average normalized spike tuning curves of each population from cell-attached recordings (as in Figure 2I). (E) Illustration of the influence of untuned excitation on the tuning curve through additive (yellow) and thresholding (red) effects. The blue area indicates the membrane potential, and the dashed red line indicates the spike threshold. (F, I) Example whole-cell current-clamp recording in which (F) spikes and (I) subthreshold voltages (Vm) have been separated. (G) Linear tuning curve area and (H) direction selectivity index of the spike tuning curve during hyperpolarizing (abscissa) and depolarizing (ordinate) current injections. (J) Linear tuning curve area and (K) direction selectivity index of peak subthreshold membrane potential tuning curves. For (G–H, J–K), regions of green (or purple) indicate that the metric is greater during depolarizing (or hyperpolarizing) injections. Points that fall on the line indicate equivalent metrics under the two conditions. Individual cells are shown as dots (Superior in magenta, Inferior in gray). Large red and blue dots represent univariate medians (collapsed across cell type) and whiskers indicate 95% confidence intervals determined via bootstrapping. Significance values indicate whether the data tend to fall unevenly on one side of the unity line (two-sided signed-rank). Arrowheads in (J, K) represent the median of Superior (magenta) and Inferior (gray) oDSGCs along the unity line, and associated significance values indicate comparison between Superior and Inferior oDSGCs (two-sided rank-sum). (L, M) Direction selectivity index for spikes (abscissa) and simultaneously measured subthreshold voltages (ordinate) under (L) depolarizing and (M) hyperpolarizing conditions. Significance values indicate whether the data tend to fall unevenly on one side of the unity line (two-sided signed-rank). (N) Residuals from the unity line for individual cells from the plots in (H) and (K). Dashed line indicates unity (i.e., no difference across depolarizing and hyperpolarizing conditions). Pairwise comparisons are shown between spikes, Vm, and Vm with additive offset. (O) Residuals from the unity line for individual cells from the plots in (L) and (M). Dashed line indicates unity (i.e., no difference between spikes and subthreshold voltages). Comparisons are made between the depolarizing and hyperpolarizing conditions (two-sided rank-sum). For box plots, the blue line represents median, box boundaries are IQR, and whiskers represent the most extreme observation within 1.5× IQR. *p<0.05, **p<0.01, ***p<0.001.

Figure 5.

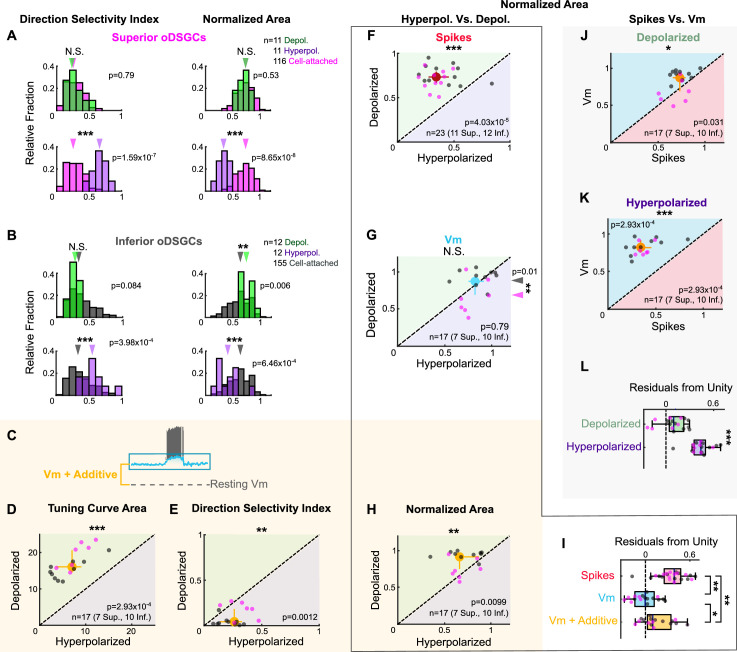
Figure 5—figure supplement 1. Spike and subthreshold voltage tuning curves with directionally untuned current injections.

Figure 5—figure supplement 1.

(A, B) Comparison of spike tuning curve metrics from cell-attached and current injection recordings. Histograms show the direction selectivity index (left) and area of the normalized tuning curve (right) for cell attached (magenta in [A] or gray in [B]), hyperpolarizing (green, top), and depolarizing (purple, bottom) conditions for (A) Superior and (B) Inferior ON direction-selective retinal ganglion cells (oDSGCs). Arrows indicate medians. (C) Illustration of the voltage offset added via current injection during the depolarizing condition. The same offset was subtracted for the hyperpolarizing condition. Diagram is not shown to scale. (D, E, H) Metrics of the subthreshold membrane potential tuning curve during hyperpolarizing (abscissa) and depolarizing (ordinate) current injections with the additive offset taken into account: (D) linear tuning curve area, (E) direction selectivity index, and (H) area of the normalized tuning curve. Additive effects cause larger and broader membrane potential tuning curves following increases in the amount of untuned excitation. (F–H) Area of the normalized tuning curve during hyperpolarizing (abscissa) and depolarizing (ordinate) current injections for (F) spikes, (G) subthreshold voltages, and (H) subthreshold voltages with the additive offset taken into account. All metrics were measured simultaneously. (I) Residuals from the unity line for individual cells from the plots in (F–H). Dashed line indicates unity (i.e., no difference across depolarizing and hyperpolarizing conditions). Pairwise comparisons are shown between spikes, Vm, and Vm with additive offset. Current injections influence spike tuning curves more than either version of the Vm tuning curve. (J, K) Area of the normalized tuning curve for spikes (abscissa) and simultaneously measured subthreshold voltages (ordinate) under (J) depolarizing and (K) hyperpolarizing conditions. (L) Residuals from the unity line for individual cells from the plots in (J, K). Dashed line indicates unity (i.e., no difference between spikes and subthreshold voltages). Comparisons are made between depolarizing and hyperpolarizing conditions (two-sided rank-sum). For all scatter plots, individual cells are shown as small dots (Superior in magenta, Inferior in gray). Colored regions indicate that the metric is greater for that condition (D–H) or for spikes or Vm (J, K). Points on the line indicate equivalent values under the two conditions. Large dots represent univariate medians collapsed across cell types and whiskers are 95% confidence intervals determined via bootstrapping. Significance values indicate whether the data tend to fall unevenly on one side of the unity line (two-sided signed-rank). For all box plots, the blue line represents median, box boundaries are IQR, and whiskers represent the most extreme observation within 1.5× IQR. *p<0.05, **p<0.01, ***p<0.001.
Figure 5—figure supplement 2. Effects of current injection on intrinsic properties of ON direction-selective retinal ganglion cells (oDSGCs).
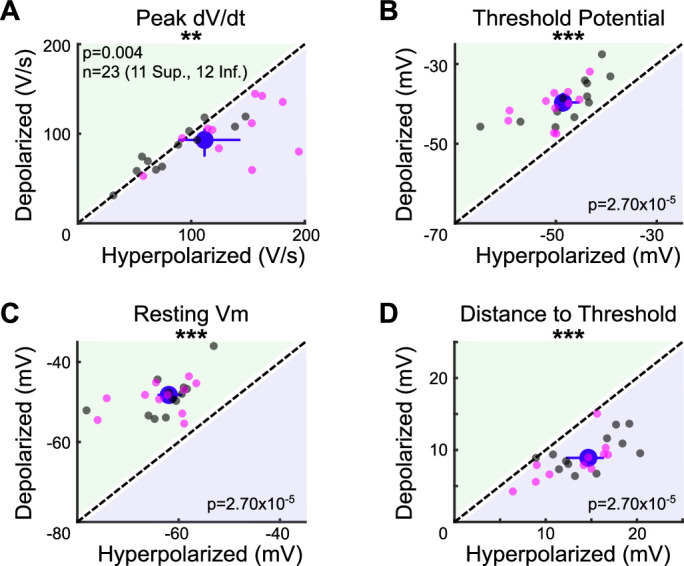
Figure 5—figure supplement 2.

To measure the effects of depolarizing and hyperpolarizing current injections on the intrinsic properties of oDSGCs, the (A) peak rate of voltage change and (B) spike threshold potential were calculated for every cell under both conditions. Peak dV/dt was on average 10.9 V/s greater under hyperpolarizing relative to depolarizing conditions. The spike threshold potential was on average 9.0 mV more negative under hyperpolarizing conditions. Both of these observations are consistent with an increase in voltage-gated sodium channel availability in the hyperpolarizing condition. This intrinsic change increases the probability of spikes during hyperpolarizing relative to the depolarizing injections, and therefore cannot explain our experimental results of greater spikes and broader tuning curves under depolarizing conditions (Figure 5). The likely reason why our empirical data show increased spiking and broader tuning curves during depolarizing injections is that the relative distance between cells’ resting membrane potentials and spike thresholds was greater in the hyperpolarizing condition. (C) The resting membrane potential was, on average, 12.6 mV more negative during hyperpolarizing injections than during depolarizing injections, whereas the spike threshold only changed by 9.0 mV (B). Thus, the difference between resting membrane potential and spike threshold was greater under hyperpolarizing conditions. (D) On average, cells’ resting membrane potentials were 5.1 mV further away from the spike threshold potential under hyperpolarizing relative to depolarizing conditions. Current injections may also influence conductances of other voltage-gated ion channels, including calcium channels, though evidence that oDSGCs express such channels is limited and these effects are difficult to quantify. For all panels, regions of green (or purple) indicate that the metric is greater for depolarizing (or hyperpolarizing) current injections. Points on the line indicate equivalent values under the two conditions. Individual cells are shown as dots (Superior in magenta, Inferior in gray). Large blue dots represent univariate medians collapsed across cell types and whiskers indicate 95% confidence intervals determined via bootstrapping. Significance values indicate whether the data tend to fall unevenly on one side of the unity line (two-sided signed-rank). *p<0.05, **p<0.01, ***p<0.001.