
Figure 7. Stimulus contrast modulates the spike tuning curves of ON direction-selective retinal ganglion cells (oDSGCs).
(A) Cell-attached tuning curves from an exemplar Superior oDSGC at high (green) and low (tan, 20% relative) contrasts. Numbers on concentric circles indicate spike counts. Dashed lines represent preferred directions. Coordinates are in retinal space. (B) Linear tuning curve area and (C) direction selectivity index from spike responses to high-contrast (abscissa) and low-contrast (ordinate) bars drifting in eight directions. Differences between Superior (magenta) and Inferior (gray) oDSGCs persist under low contrast (see Figure 2). (D) Linear tuning curve area and (E) direction selectivity index from peak subthreshold voltage responses to high-contrast (abscissa) and low-contrast (ordinate) bars drifting in eight directions. (F) Residuals from the unity line of the direction selectivity index under high- and low-contrast conditions for simultaneously measured spikes and subthreshold voltages. Comparison is made between spikes and subthreshold voltages. For all scatter plots, the region of green (or tan) indicates the metric is greater under high-contrast (or low-contrast) conditions. Points on the line indicate equivalent metrics under the two conditions. Individual cells are represented by small dots. Large dots represent univariate medians (collapsed across cell type). Whiskers indicate 95% confidence intervals determined via bootstrapping. Significance values indicate whether the data tend to fall unevenly on one side of the unity line (two-sided signed-rank). *p<0.05, **p<0.01, ***p<0.001.
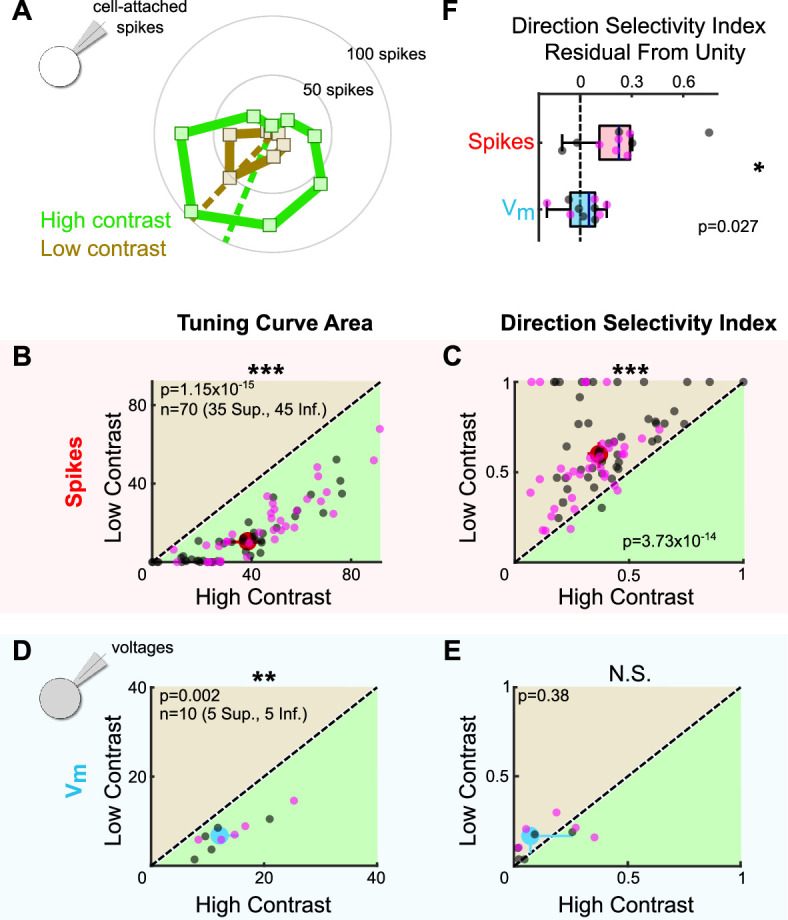
Figure 7—figure supplement 1. Stimulus contrast modulates spike tuning curve width but not the ratio of excitation to inhibition.

Figure 7—figure supplement 2. Two-photon targeting confirms that ON direction-selective retinal ganglion cells (oDSGCs) are contrast sensitive.
