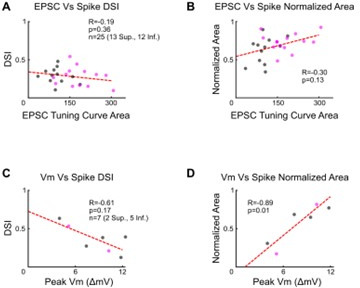
Author response image 2. Strength of excitatory input and spike tuning curve properties.

(A-B) Relationships between excitatory postsynaptic current (EPSC) tuning curve area and (A) direction selectivity index or (B) normalized area of the spike tuning curve. Data taken from cells in which both voltage-clamp and cell-attached recordings were made. (C-D) Relationships between the peak subthreshold membrane potential in the cell’s null direction and (C) the direction selectivity or (D) normalized area of the spike tuning curve for cells recorded in the current-clamp configuration with no current injection. For all panels, R and p values are Spearman’s rank correlation coefficient and associated 2-sided p-value. Dashed lines are least squares linear regressions.
