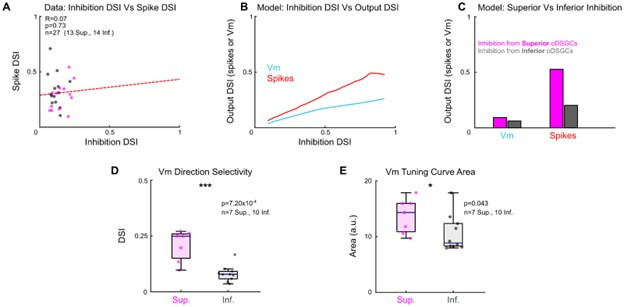
Author response image 3. (A) Comparison of the direction selectivity index (DSI) computed for inhibitory inputs (from voltage-clamp recordings) and for spikes (cell-attached recordings) for cells in which both metrics were recorded.

There is no significant relationship, indicating that inhibition is a poor predictor of spike tuning, but this may be caused by noise contributed by other circuit and cell-intrinsic processes. R and p values are Spearman’s rank correlation coefficient and associated 2-sided significance values, respectively. The dashed line is a least squares linear regression. (B) Using our parallel conductance model, the subthreshold membrane potential (Vm) and spike DSI were computed as a function of the DSI of inhibition. For oDSGCs, narrower inhibitory tuning curves predict narrower Vm and spike tuning curves. (C) Output of two additional iterations of the parallel conductance model in which inhibitory conductances were taken only from data recorded from Superior oDSGCs (magenta bars) or only from data recorded from Inferior oDSGCs (gray bars). All other parameters of the model (including excitation, input resistance, threshold potential, and resting membrane potential) were held constant across conditions. All else equal, the model predicts that the inhibitory inputs to Superior oDSGCs predict sharper Vm and spike tuning curves than the inhibitory inputs to Inferior oDSGCs do. (D) Direction selectivity indices of Vm tuning curves, recorded empirically in current-clamp mode. Superior oDSGCs have sharper Vm tuning curves than Inferior oDSGCs. This result matches the prediction of the model from (C), and indicates that sharper inhibitory tuning in Superior oDSGCs does not predict their broader spike tuning curves. These data are also shown in Figure 5K. (E) Area of linear Vm tuning curves recorded empirically in current-clamp mode. Superior oDSGCs have larger Vm tuning curves. This can be accounted for by their larger excitatory inputs (Figure 3G) and explains their broader spike tuning curves. These data are also shown in Figure 5J.
