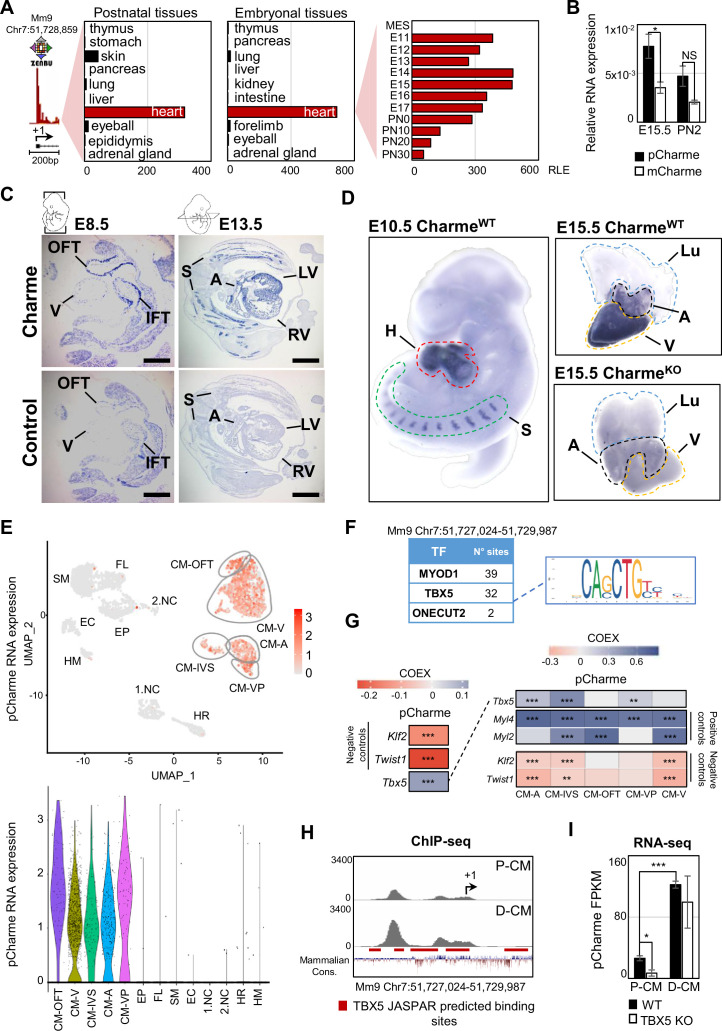
Figure 1. Charme locus expression in developing mouse embryos and in the heart.
(A) Transcriptional start site (TSS) usage analysis from FANTOM5 CAGE phase1 and 2 datasets (skeletal muscle is not included) on the last update of Zenbu browser (https://fantom.gsc.riken.jp/zenbu/; FANTOM5 Mouse mm9 promoterome) showing Charme locus expression in postnatal and embryonal body districts (left and middle panels) and during different stages of cardiac development (right panel, E11–PN30). MES, mesoderm. Bars represent the relative logarithmic expression (RLE) of the tag per million values of Charme TSS usage in the specific samples. (B) Quantitative reverse transcription PCR (RT-qPCR) amplification of pCharme and mCharme isoforms in RNA extracts from CharmeWT E15.5 and neonatal (PN2) hearts. Data were normalized to Gapdh mRNA and represent means ± SEM of 3 independent biological pools (at least 3 littermates/pool). (C) In situ hybridization (ISH) performed on embryonal cryo-sections using digoxigenin-labeled RNA antisense (Charme, upper panel) or sense (control, lower panel) probes against Charme. Representative images from two stages of embryonal development (E8.5 and E13.5) are shown. OFT, outflow tract; IFT, inflow tract; V, ventricle; LV/RV, left/right ventricle; A, atria; S, somites. Scale bars, 1mm. (D) Whole-mount in situ hybridization (WISH) performed on CharmeWT intact embryos (E10.5, left panel) and CharmeWT and CharmeKO hearts at their definitive morphologies (E15.5, right panels). Signal is specifically detected in heart (H, red line) and somites (S, green line). Lungs (Lu, blue line) show no signal for Charme. The specificity of the staining can be appreciated by the complete absence of signal in explanted hearts from CharmeKO mice (Ballarino et al., 2018). A, atria (black line); V, ventricles (yellow line). (E) Upper panel: UMAP plot showing pCharme expression in single-cell transcriptomes of embryonal (E12.5) hearts (Jackson-Weaver et al., 2020). Lower panel: violin plot of pCharme expression in the different clusters (see ‘Materials and methods’ for details). CM, cardiomyocytes; CM-A, atrial-CM; CM-V, ventricular-CM; ISV, interventricular septum; VP, venous pole; OFT, outflow tract; NC, neural crest cells; EP, epicardial cells; FL, fibroblasts-like cells; EC, endothelial cells; SM, smooth muscle cells; HM, hemopoietic myeloid cells; HR, hemopoietic red blood cells. (F) In silico analysis of MYOD1, TBX5, and ONECUT2 transcription factors (TF) binding sites using Castro-Mondragon et al., 2022 (relative profile score threshold = 80%). Castro-Mondragon et al., 2022 MyoD1 and Onecut2 were used as positive and negative controls, respectively. N° sites, number of consensus motifs. (G) COTAN heatmap obtained using the whole scRNA-seq (left) and contrasted subsetted dataset (right) showing pCharme and Tbx5 expression correlation (COEX). Myl4 and Myl2 were used as positive controls for cardiomyocytes while Klf2 and Twist1 as negative controls (markers of EC and NC, respectively). See ‘Materials and methods’ for details. (H) TBX5 ChIP-seq analysis across Charme promoter in murine precursors (P-CM) and differentiated cardiomyocytes (D-CM) (GSE72223, Luna-Zurita et al., 2016). The genomic coordinates of the promoter, the Charme TSS (+1, black arrow), the TBX5 JASPAR predicted binding sites (red lines), and the mammalian conservation track (Mammalian Cons.) from UCSC genome browser are reported. (I) Quantification of pCharme expression from RNA-seq analyses performed in wild type (WT) and TBX5 knockout (KO) murine P-CM and D-CM (SRP062699, Luna-Zurita et al., 2016). FPKM, fragments per kilobase of transcript per million mapped reads. Data information: *p<0.05; ***p<0.001; NS > 0.05, unpaired Student’s t-test.


