. 2023 Mar 6;12:e81360. doi: 10.7554/eLife.81360

Figure 2. Genome-wide profiling of cardiac CharmeWT and CharmeKO transcriptomes.

(A) Heatmap visualization from RNA-seq analysis of CharmeWT and CharmeKO neonatal (PN2) hearts. Plot was produced by heatmap3 (Zhao, 2021). Expression values were calculated as FPKM, were log2-transformed and mean-centered. FPKM, fragments per kilobase of transcript per million mapped reads. (B) Volcano plots showing differential gene expression from transcriptome analysis of CharmeWT vs. CharmeKO PN2 hearts. Differentially expressed genes (DEGs) validated through RT-qPCR (C) are in evidence. FC, fold change. (C) RT-qPCR quantification of upregulated (left panel) and downregulated (right panel) DEGs in CharmeWT vs. CharmeKO neonatal hearts. Data were normalized to Gapdh mRNA and represent means ± SEM of WT (n = 5) vs. KO (n = 4) independent biological pools (at least 3 littermates/pool). (D) Gene Ontology (GO) enrichment analysis performed by WebGestalt (http://www.webgestalt.org) on upregulated (left panel) and downregulated (right panel) DEGs in CharmeWT vs. CharmeKO pools of neonatal hearts. Bars indicate the top categories of biological processes in decreasing order of – log10FDR. All the represented categories show a false discovery rate (FDR) value <0.05. (E) RT-qPCR quantification of pCharme targets in CharmeWT and CharmeKO extracts from E12.5, E15.5, and E18.5 hearts. DEGs belonging to the GO category ‘anatomical structure morphogenesis’ were considered for the analysis. Data were normalized to Gapdh mRNA and represent means ± SEM of WT and KO (n = 3) independent biological pools (at least 3 littermates/pool). (F) RT-qPCR quantification of the Myh6/Myh7 ratio in CharmeWT and CharmeKO extracts from E12.5, E15.5, and E18.5 and neonatal hearts. Data were normalized to Gapdh mRNA and represent means ± SEM of WT and KO (n = 3) independent biological pools (at least 3 littermates/pool). Schematic representation of the physiological Myh6/Myh7 expression trend is shown. (G) Upper panel: hematoxylin-eosin staining from CharmeWT and CharmeKO E15.5 cardiac transverse sections. Scale bars: 500 μm. Lower panel: quantification of the total area, the left and right ventricle cavities, and the thickness of the interventricular septum (IVS) in CharmeWT and CharmeKO E15.5 hearts. For each genotype, data represent the mean ± SEM of WT and KO (n = 3) biological replicates. (H) Representative images of Nppa (green) and TnnT2 (red) immunostaining in CharmeWT and CharmeKO (E15.5) cardiac sections. Regions of interest (ROI, orange squares) were digitally enlarged on the lower panels. Scale bar: 500 µm. Quantification of the area covered by the Nppa fluorescent signal is shown aside. Data represent the mean (%) ± SEM of WT (n = 4) and KO (n = 3) biological replicates. Data information: *p<0.05; **p<0.01, NS > 0.05, unpaired Student’s t-test.

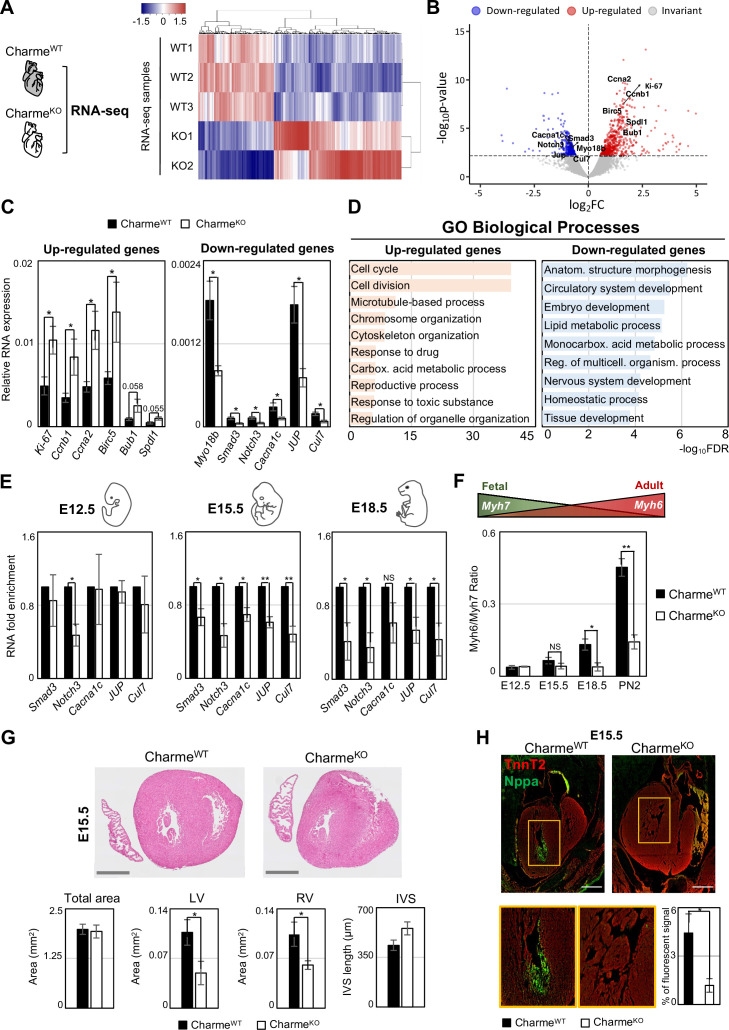
Figure 2.

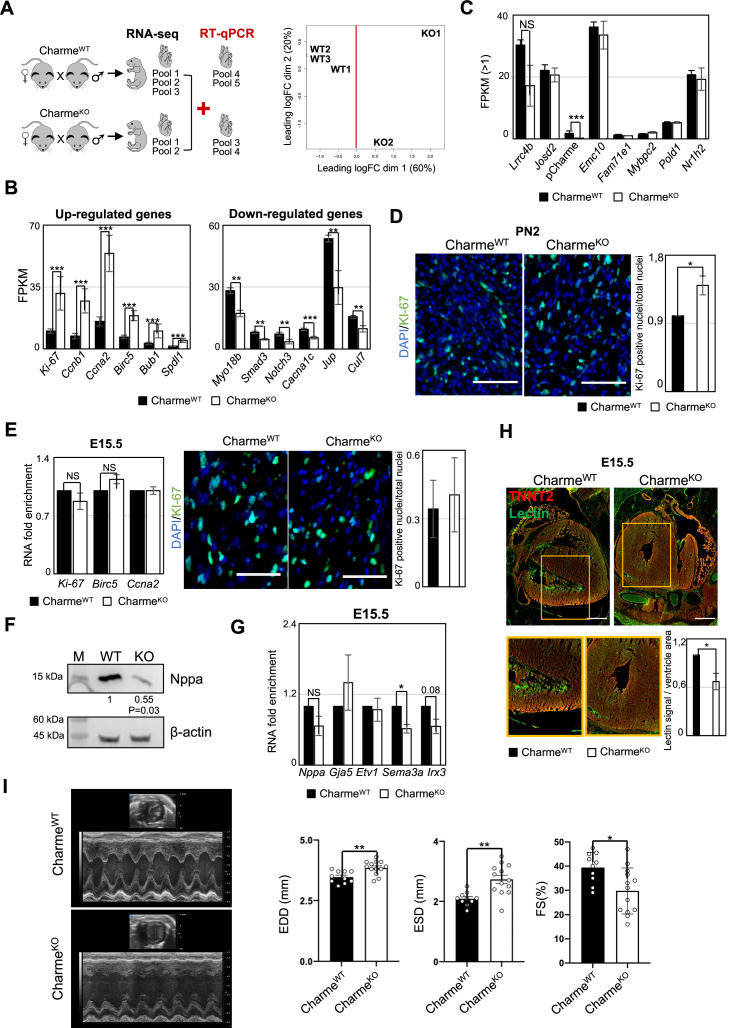
Figure 2—figure supplement 1. Transcriptomic and phenotypic characterization of CharmeWT and CharmeKO hearts.

Figure 2—figure supplement 1.

(A) Schematic overview of the workflow to identifying differentially expressed genes (DEGs) from CharmeWT and CharmeKO transcriptomes (left panel). Multidimensional scaling plot of leading fold change (FC) between each pair of CharmeWT and CharmeKO RNA-seq samples (right panel). Plot was obtained by using the plotMDS function from edgeR package (Chen et al., 2022). (B) Quantification by RNA-seq (FPKM) of upregulated (left panel) and downregulated (right panel) DEGs in CharmeKO vs. CharmeWT neonatal hearts. (C) Quantification by RNA-seq (FPKM) of pCharme and Charme-neighboring genes expression in CharmeWT vs. CharmeKO neonatal hearts. (D) Left panel: representative images for KI-67 (green) and DAPI (blue) stainings on CharmeWT and CharmeKO neonatal cardiac sections. Scale bars: 70 µm. Right panel: quantification of KI-67-positive nuclei/total nuclei on CharmeWT and CharmeKO cardiac sections from neonatal mice. Data are expressed as mean ± SEM of WT and KO (n = 4) biological replicates. (E) Left panel: RT-qPCR quantification of DEGs belonging to the ‘cell cycle’ GO class from CharmeWT and CharmeKO E15.5 hearts. Data were normalized to Gapdh mRNA and represent means ± SEM of WT and KO (n = 3) independent biological pools (at least 3 littermates/pool). Right panel: representative images for KI-67 (green) and DAPI (blue) stainings on CharmeWT and CharmeKO E15.5 cardiac sections are shown. Quantification of KI-67-positive nuclei/total nuclei on CharmeWT and CharmeKO cardiac sections from E15.5 mice. Data are mean ± SEM. of WT and KO (n = 3) biological replicates. Scale bars: 140 µm. (F) Western blot analysis for NPPA in CharmeWT and CharmeKO E15.5 cardiac extracts. β-ACTIN was used as a loading control. Quantification of NPPA signal intensity relative to β-ACTIN is shown below. Data are mean ± SEM of WT and KO (n=3) biological replicates. *p=0.03. A representative image is shown. (G) RT-qPCR quantification of trabeculae markers expression in CharmeWT vs. CharmeKO E15.5 cardiac extracts. Data were normalized to Gapdh mRNA and represent means ± SEM of WT and KO (n = 3) independent biological pools (at least 3 littermates/pool). (H) Representative image of Lectin (green) and TnnT2 (red) immunostainings in CharmeWT and CharmeKO E15.5 cardiac sections. Regions of interest (ROIs) (orange squares) were digitally enlarged on the lower panels. Scale bars: 500 µm. Quantification of the area covered by the Lectin fluorescence signal is shown aside. For each genotype, data represent the mean ± SEM. of WT and KO (n = 3) biological replicates. (I) Representative M-mode echocardiographic track of CharmeWT and CharmeKO 9–12 months aged mice. Quantification of heart morphology (EDD, end-diastolic diameter; ESD, end-systolic diameter) and function (FS: Fractional Shortening = (EDD-ESD)/EDD) were evaluated. Data represent the mean ± SEM of WT and KO (n = 10–13) biological replicates. Data information: *p<0.05, **p<0.01, ***p<0.001, unpaired Student’s t-test.