. 2023 Mar 6;12:e81360. doi: 10.7554/eLife.81360

Figure 3. In fetal cardiomyocytes pCharme promotes MATR3 nuclear condensation.

(A) RNA-FISH for pCharme (red) and DAPI staining (blue) in CharmeWT cardiac and spinal cord from E15.5 tissue sections. Whole heart (white dashed lines), spinal cord (yellow dashed line). A, atria; LV and RV, left and right ventricle; DH and VH, dorsal and ventral horn. Scale bars, 500 μm. (B) Upper panel: RNA-FISH for pCharme (red) combined with immunofluorescence for MATR3 (green) and DAPI staining (gray) in CharmeWT from E15.5 cardiac sections. Dashed lines show the edge of nuclei. Lower panel: selected nuclei (yellow dashed lines in the upper panel) were enlarged and processed for isosurface reconstruction (left panel) and digital magnification (right panel). Overlapped signals are shown (asterisks). Scale bars, 5 μm. (C) Upper panel: representative images for MATR3 (green), TnnT2 (red), and DAPI (blue) stainings on CharmeWT and CharmeKO E15.5 cardiac sections. Lower panel: representative images for MATR3 (green), the Microtubule-associated protein 2 (MAP2) (red), and DAPI (blue) stainings on CharmeWT and CharmeKO E15.5 spinal cord sections. Regions of interest (ROI) (orange squares) were digitally enlarged on the right panels. Each image is representative of three individual biological replicates. Scale bars, 10 μm.

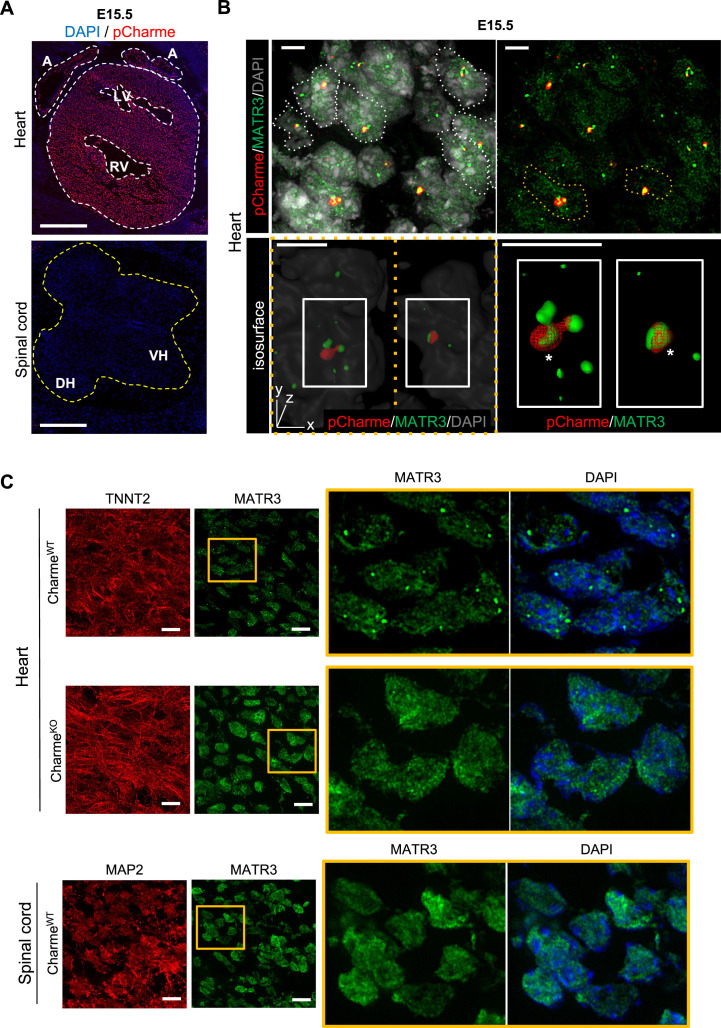
Figure 3.

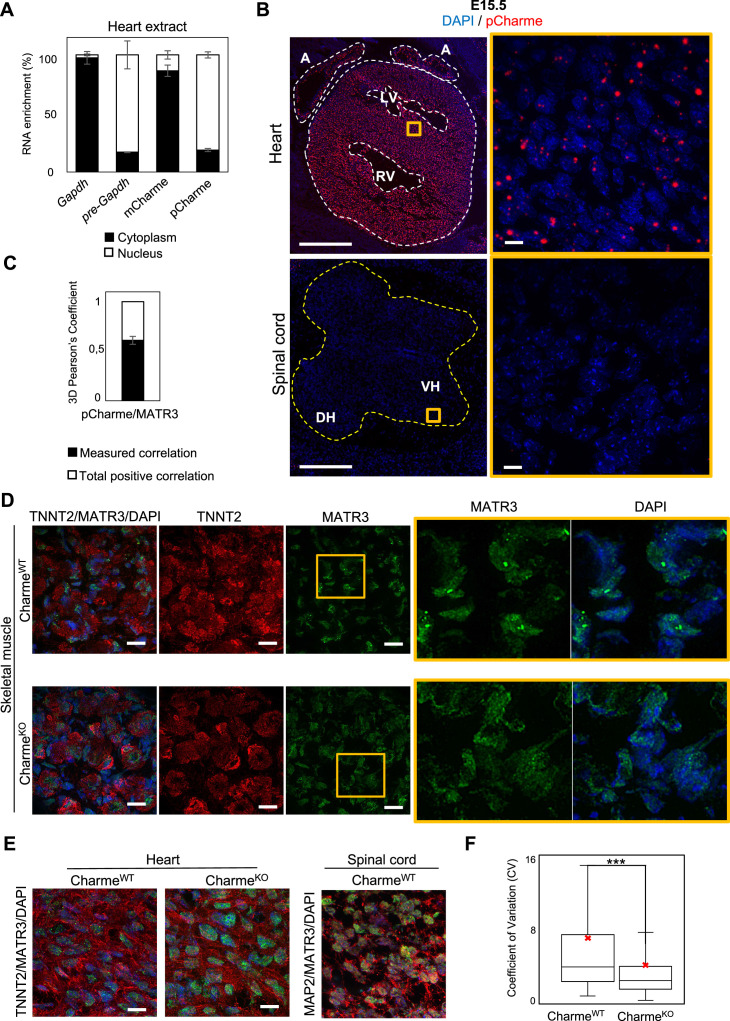
Figure 3—figure supplement 1. pCharme and MATR3 nuclear localization analyses.

Figure 3—figure supplement 1.

(A) Quantification of the subcellular distribution of pCharme and mCharme in cardiac tissues from neonatal mice. Histogram shows the quantification by RT-qPCR of the RNA abundance (%) in cytoplasmic versus nuclear compartments. Gapdh and pre-Gapdh RNAs were used, respectively, as cytoplasmic and nuclear controls. Data represent means ± SEM of (n = 3) technical replicates (B) RNA-FISH for pCharme (red) and DAPI staining (blue) in CharmeWT hearts and spinal cord from E15.5 tissue sections (left panels) and their magnification (right panels). Whole heart (white dashed lines), spinal cord (yellow dashed line). A, atria; LV and RV: left and right ventricle; DH and VH: dorsal and ventral horn. Scale bars, 500 μm; 10 μm for magnifications. (C) 3D Pearson’s correlation coefficient of pCharme/MATR3 overlapping signals. Histogram shows the mean ± SEM calculated over 237 colocalized nuclear signals from (n=3) independent experiments. (D) Representative images for MATR3 (green), TnnT2 (red), and DAPI (blue) stainings on CharmeWT and CharmeKO skeletal muscles from E15.5 tissue sections. Regions of interest (ROI) (orange squares) were digitally enlarged on the right panels. Each image is a representative of three individual samples. Scale bars, 10 μm. (E) Left panel: Representative images for for MATR3 (green), TnnT2 (red), and DAPI (blue) stainings on CharmeWT and CharmeKO heart from E15.5 tissue sections. Right panel: representative images for MATR3 (green), MAP2 (red), and DAPI (blue) stainings on CharmeWT and CharmeKO spinal cord from E15.5 tissue sections. Each image is a representative of three individual samples. Scale bars, 10 μm. (F) Quantification of MATR3 fluorescence intensity distribution (CV, coefficient of variation) in CharmeWT (N = 1346 nuclei) and CharmeKO (N = 1404 nuclei). The red X indicates the mean value of CV distribution.