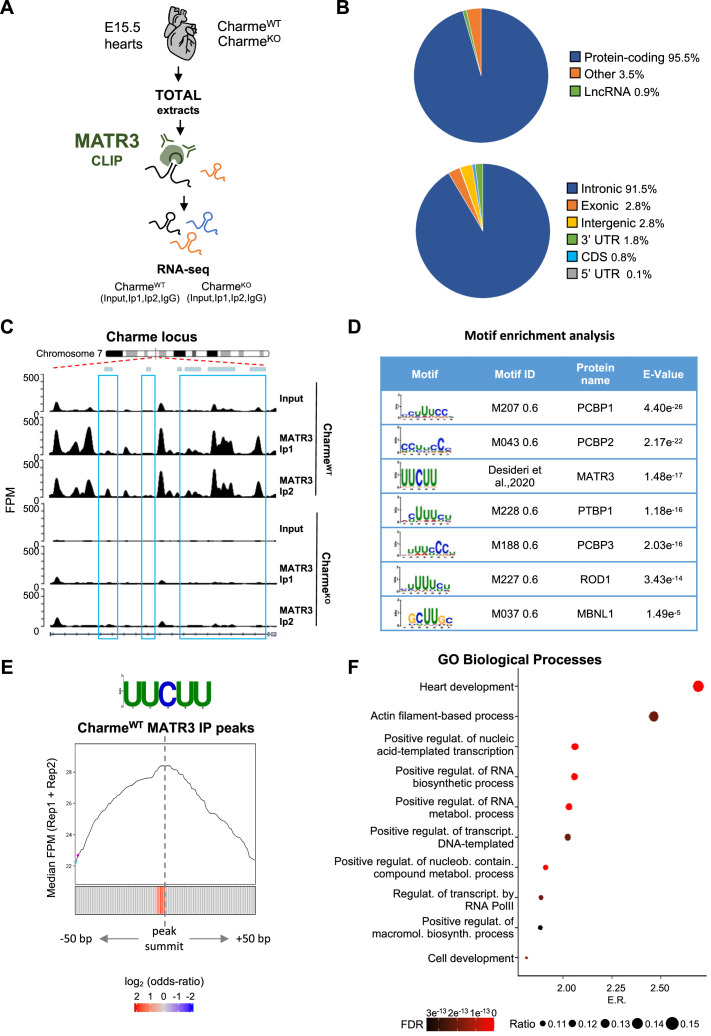
Figure 4. MATR3/pCharme nuclear condensates contain key regulators of heart development.
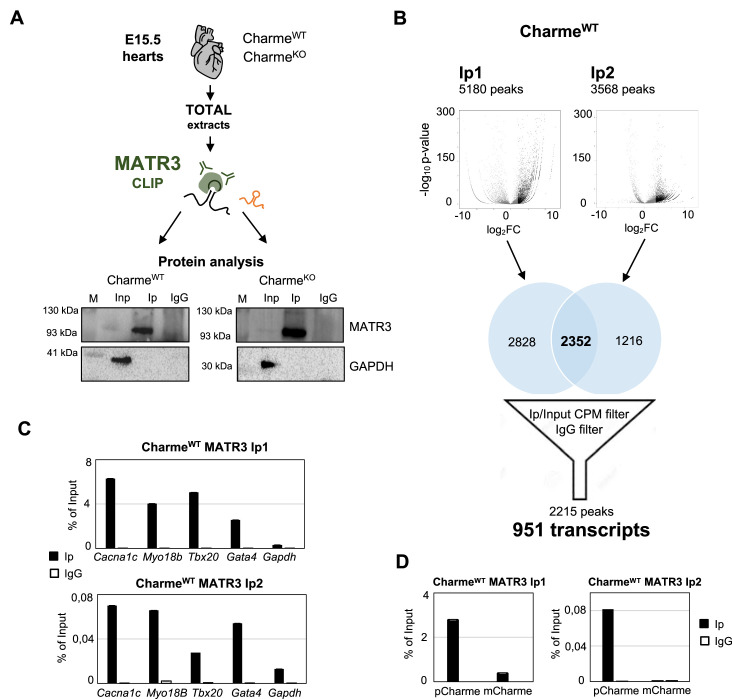
(A) Schematic representation of MATR3 CLIP-seq workflow from fetal (E15.5) CharmeWT and CharmeKO hearts. See ‘Materials and methods’ for details. (B) MATR3 CLIP-seq from fetal hearts. Upper panel: a pie-plot projection representing transcript biotypes of 951 identified MATR3 interacting RNAs. Peaks overlapping multiple transcripts were assigned with the following priority: protein coding, lncRNA, and others. Lower panel: a pie-plot projection representing the location of MATR3 enriched peaks (log2 fold enrichment >2 and false discovery rate [FDR] <0.05). Peaks overlapping multiple regions were assigned with the following priority: CDS, 3’UTR, 5’UTR, exons, introns, and intergenic. Percentages relative to each group are shown. (C) MATR3 CLIP-seq (Input, Ip1, and Ip2) normalized read coverage tracks (FPM) across pCharme from fetal hearts. Significant MATR3 peaks, displaying log2 fold enrichment >2 in both Ip1 and Ip2 samples compared to Input, are demarcated by light-blue boxes. Normalized read coverage tracks (FPM) from MATR3 CLIP-seq in CharmeKO fetal hearts on Charme locus are also shown. Plot obtained using Gviz R package. (D) Motif enrichment analysis perfomed on MATR3 CLIP-seq peaks (CharmeWT) with AME software using 93 RNA binding motifs from CISBP-RNA database. Seven consensus motifs resulted significantly over-represented (E value <0.05) among the MATR3 peaks compared to control regions. See ‘Materials and methods’ for details. (E) Positional enrichment analysis of MATR3 motif in MATR3 CLIP-seq top 500 peaks (CharmeWT, average log2 fold change). For each of the analyzed positions close to peak summit, line plot displays the median CLIP-seq signal (FPM, IP1 + IP2), while heatmap displays the log2 odds ratio of UUCUU motif enrichment. Significant enrichments (Bonferroni corrected p-value<0.05) are shown in red. See ‘Materials and methods’ for details. (F) GO enriched categories obtained with WebGestalt (http://www.webgestalt.org) on protein-coding genes overlapping CharmeWT MATR3 peaks. Dots indicate the top categories of biological processes (description in y-axis) in decreasing order of enrichment ratio (E.R., overlapped genes/expected genes, x-axis). Dot size (ratio) represents the ratio between overlapped gens and GO categories size while dot color (FDR) represents significance. All the represented categories show an FDR < 0.05.


