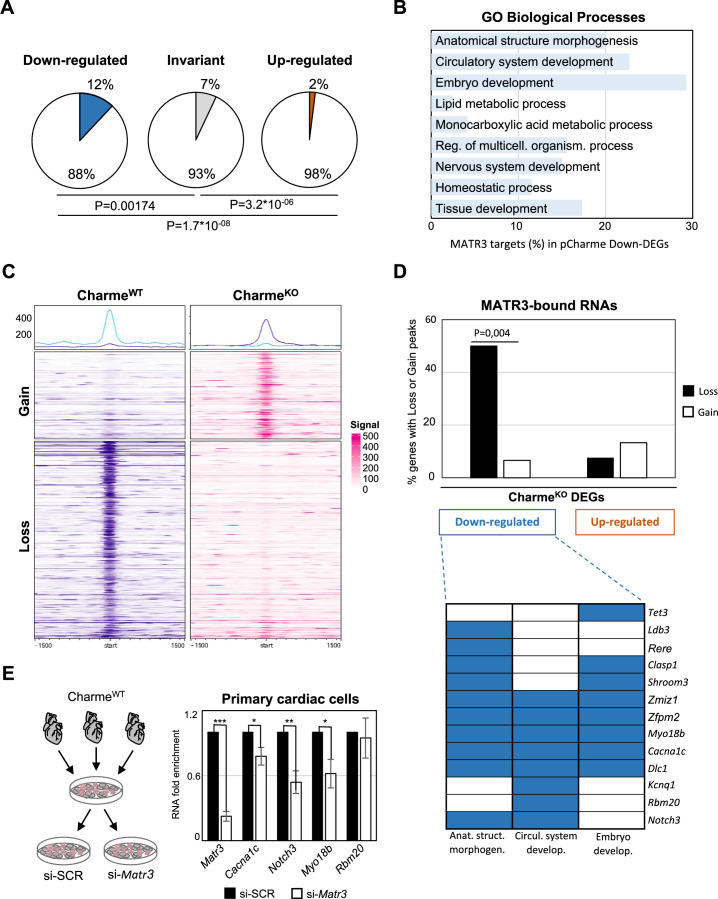
Figure 5. The pCharme/MATR3 interaction in cardiomyocytes sustains developmental genes expression.
(A) Pie charts showing the percentage of MATR3 targets in CharmeKO downregulated, invariant, or upregulated differentially expressed genes (DEGs). Significance of enrichment or depletion was assessed with two-sided Fisher’s exact test, shown below. (B) MATR3 targets (%) in the GO categories enriching CharmeKO downregulated DEGs (Down-DEGs) (see also Figure 2A). (C) Profile heatmaps of differential MATR3 CLIP-seq peaks (CharmeWT vs. CharmeKO). Normalized mean read counts of both IP samples are shown only for significant (false discovery rate [FDR] < 0.05) ‘Gain’ and ‘Loss’ peaks. (D) Upper panel: histogram showing the distribution (%) of ‘Gain’ and ‘Loss’ MATR3 peaks in pCharme DEGs. Significance of enrichment was assessed with two-sided Fisher’s exact test. Lower panel: distribution of the subset (13 out of 20) of Down-DEGs with Loss peaks in the first three GO categories identified for downregulated genes (see also Figure 2A). (E) Left panel: schematic representation of primary cells extraction from CharmeWT hearts. Once isolated, cells were plated and transfected with the specific siRNA (si-Matr3) or control siRNA (si-SCR). See ‘Materials and methods’ for details. Right panel: RT-qPCR quantification of Matr3, Cacna1c, Notch3, Myo18b, and Rbm20 RNA levels in primary cardiac cells treated with si-SCR or si-Matr3. Data were normalized to Gapdh mRNA and represent mean ± SEM of (n=4) independent biological experiments. Data information: *p<0.05; **p<0.01; ***p<0.001, unpaired Student’s t-test.


