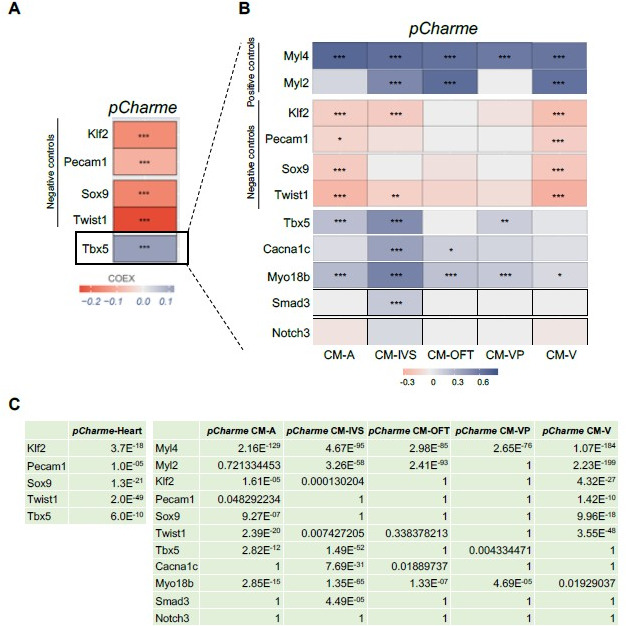
Author response image 1. Correlation of Tbx5 and pCharme expression in cardiomyocytes.

(A) COTAN heatmap obtained using the whole scRNA-seq dataset showing Charme positive correlation with Tbx5, both expressed in cardiomyocytes, and its negative correlation with Klf2, Pecam1, Sox9 and Twist1, which are genes typically expressed in other cell populations. (B) COTAN heatmap for the contrasted subsetted data (see Materials and methods). The positive correlation between Tbx5 and Charme is particularly strong for CM-IVS, CM-A, and CM-P. In the other two cardiomyocyte clusters Tbx5 is very lowly expressed. (C) Adjusted p-values for the correlations plot in A (left) and B (right).
