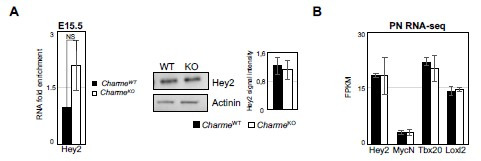
Author response image 2. Expression analysis of compact layer marker genes.

(A) Left panel: RT-qPCR quantification of Hey2 RNA levels in E15. 5 CharmeWT vs CharmeKO cardiac extract. RT-qPCR data were normalized to GAPDH mRNA and represent means ± SEM of WT and KO (n=3) pools. Right panel: Representative image from western blot analysis and quantification for Hey2 in CharmeWT and CharmeKO E15.5.5 hearts extract. actinin was used as a loading control. Plot represent the quantification of Hey2 signal intensity relative to actinin. Data are mean ± SEM (n = 3). (B) Average expression from neonatal (PN) RNA-seq (FPKM) of compact tissue marker genes.
