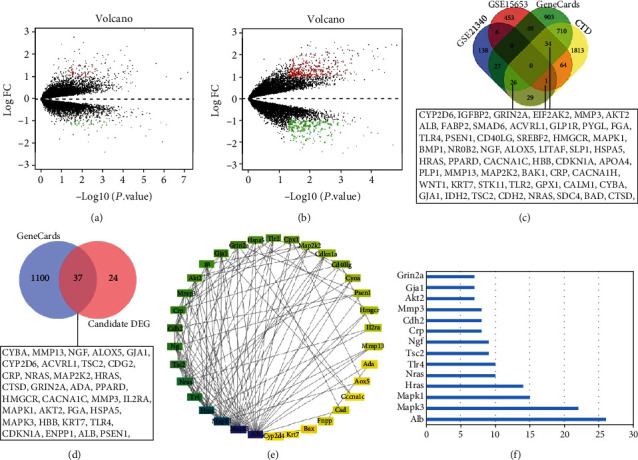
Figure 2.

Screening of genes associated with vascular injury in T2DM using datasets in GEO database. (a) Differentially expressed mRNAs in T2DM samples and normal samples from GSE21340 and GSE15653. (b) Differentially expressed mRNAs in T2DM samples and normal samples from GSE15653. Green dots indicated downregulated genes, red dots indicated upregulated genes, and gray dots indicated genes with no significant difference. (c) Venn diagram of DEGs in GSE21340 and GSE15653 datasets and results from GeneCards and CTD databases. (d) Venn analysis of screening genes in panel (c) and vascular injury-related genes in GeneCards database. (e) Interaction network diagram of the 37 candidate DEGs (nodes represented proteins and edges represented protein-protein associations). (f) The degree value of the candidate DEGs.
