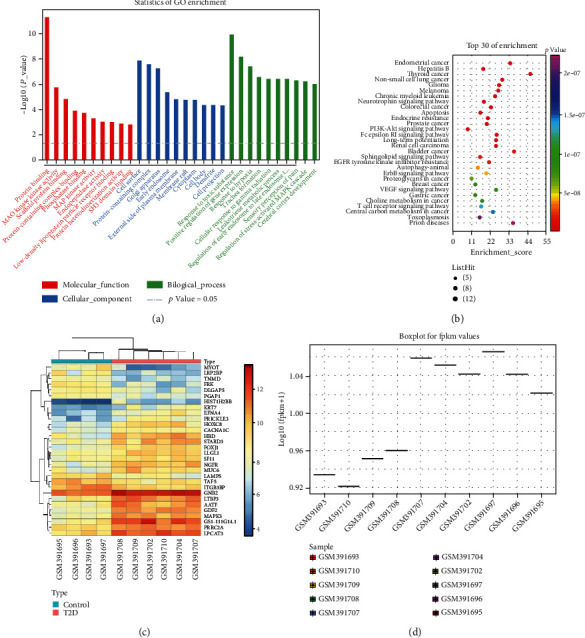
Figure 3.

Secondary screening of core genes involved in the development of vascular damage in T2DM. (a) GO functional analysis of candidate DEGs at the BP, CC, and MF levels. (b) KEGG pathway enrichment analysis of candidate DEGs. Dot size indicated the number of selected genes, and color represented the p value for enrichment analysis. (c) Heat maps of candidate DEG expression matrix in different samples; the warmer the color of the block, the higher the expression. (d) MAPK3 expression in T2DM in GSE15653.
