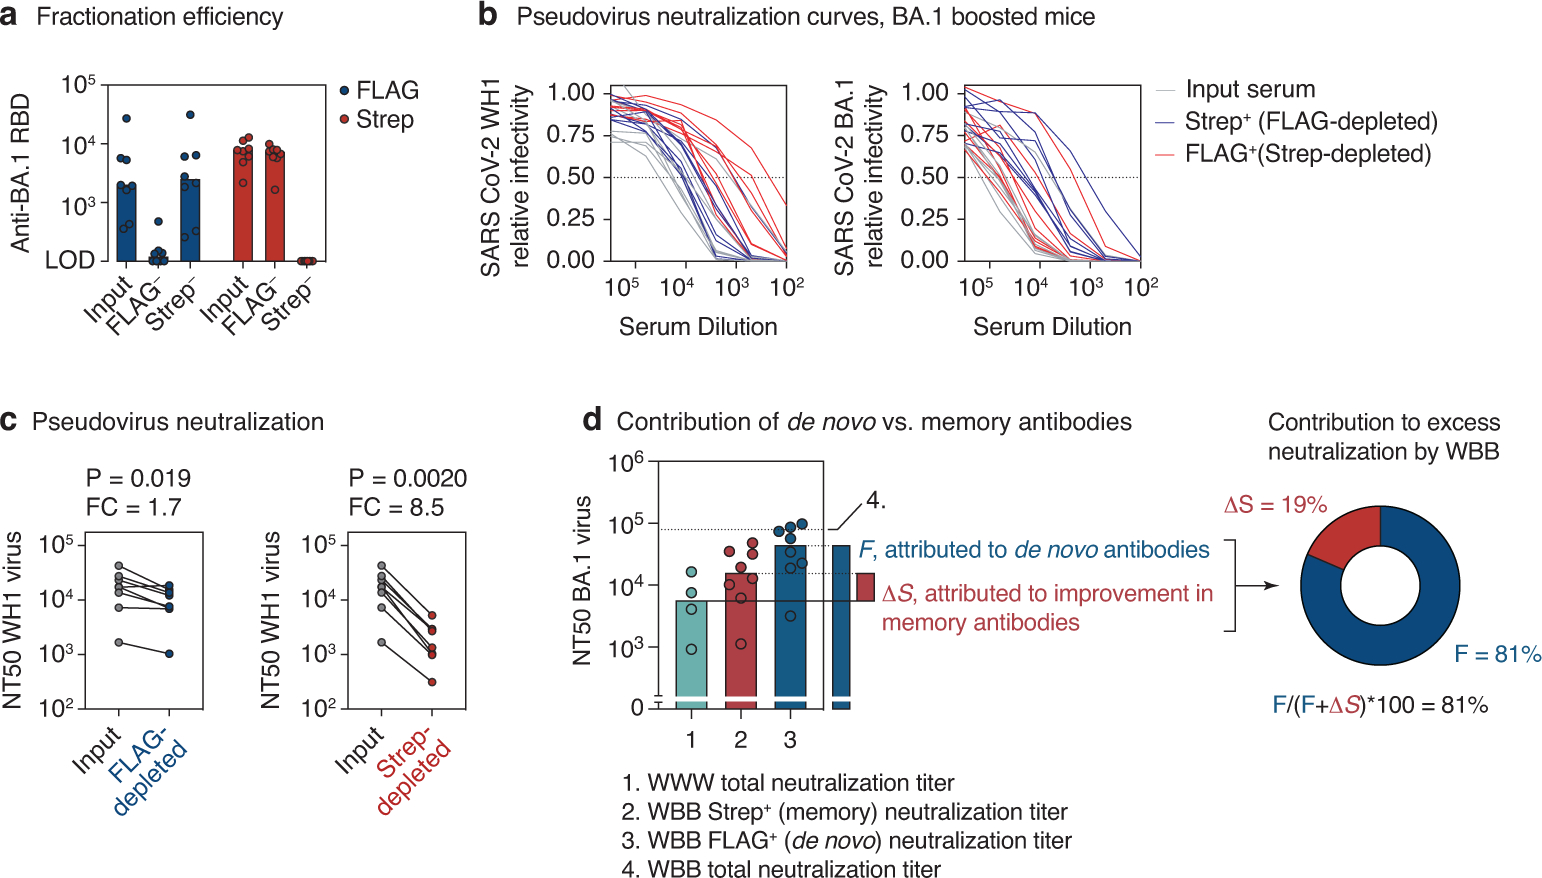
Extended Data Figure 5 |. Neutralization of WH1 and BA.1 pseudoviruses by serum antibody fractions from BA.1 boosted mice.

(a) Efficiency of serum fractionation into FLAG and Strep-depleted fractions, as measured by anti-RBD ELISA of input vs. post-depletion samples. Serum was obtained from heterologously immunized mice two weeks after the 3rd immunization, Fig. 4d (8 mice from 2 independent experiments). (b) Neutralization of WH1 (left) and BA.1 (right) SARS-CoV-2 S-expressing pseudotyped HIV-1 virus by serum fractions shown in (a). Mean values of technical duplicates are shown. (c) WH1 S pseudovirus NT50 titers for samples in (b). Post-depletion NT50s were normalized to input serum based on the BA.1 RBD ELISA titers (a), by applying a correction equalizing the anti-RBD Strep-titer of the FLAG-depleted fraction to the input, and the anti-RBD FLAG-titer of the Strep-depleted fraction to the input. P-values are for one-tailed paired T test. FC, fold-change. (d) Estimating the contribution of de novo vs. memory-derived antibodies to excess BA.1 neutralization by the WBB regimen. The contribution of secondary affinity maturation or preferential selection of crossreactive memory B cells by BA.1 boosting, μS, is calculated as the difference between Strep+ WBB and total WWW BA.1 neutralization titers (the latter are assumed to be all FLAG+). The contribution of BA.1-specific antibodies induced de novo by BA.1 boosting, F, is given as the FLAG+ WBB titer. Percent contribution of F to the improved BA.1 neutralization in WBB is calculated as (F/(F+μS))*100. Bars and dotted lines represent the medians for each condition, which were used to calculate F and μS. The upper dotted line (4.) represents the median neutralization of total WBB antibodies and is shown for reference purposes only. Data in groups 1 and 4 are reproduced from Fig. 4b, data in group 2 and 3 from Fig. 4h.
