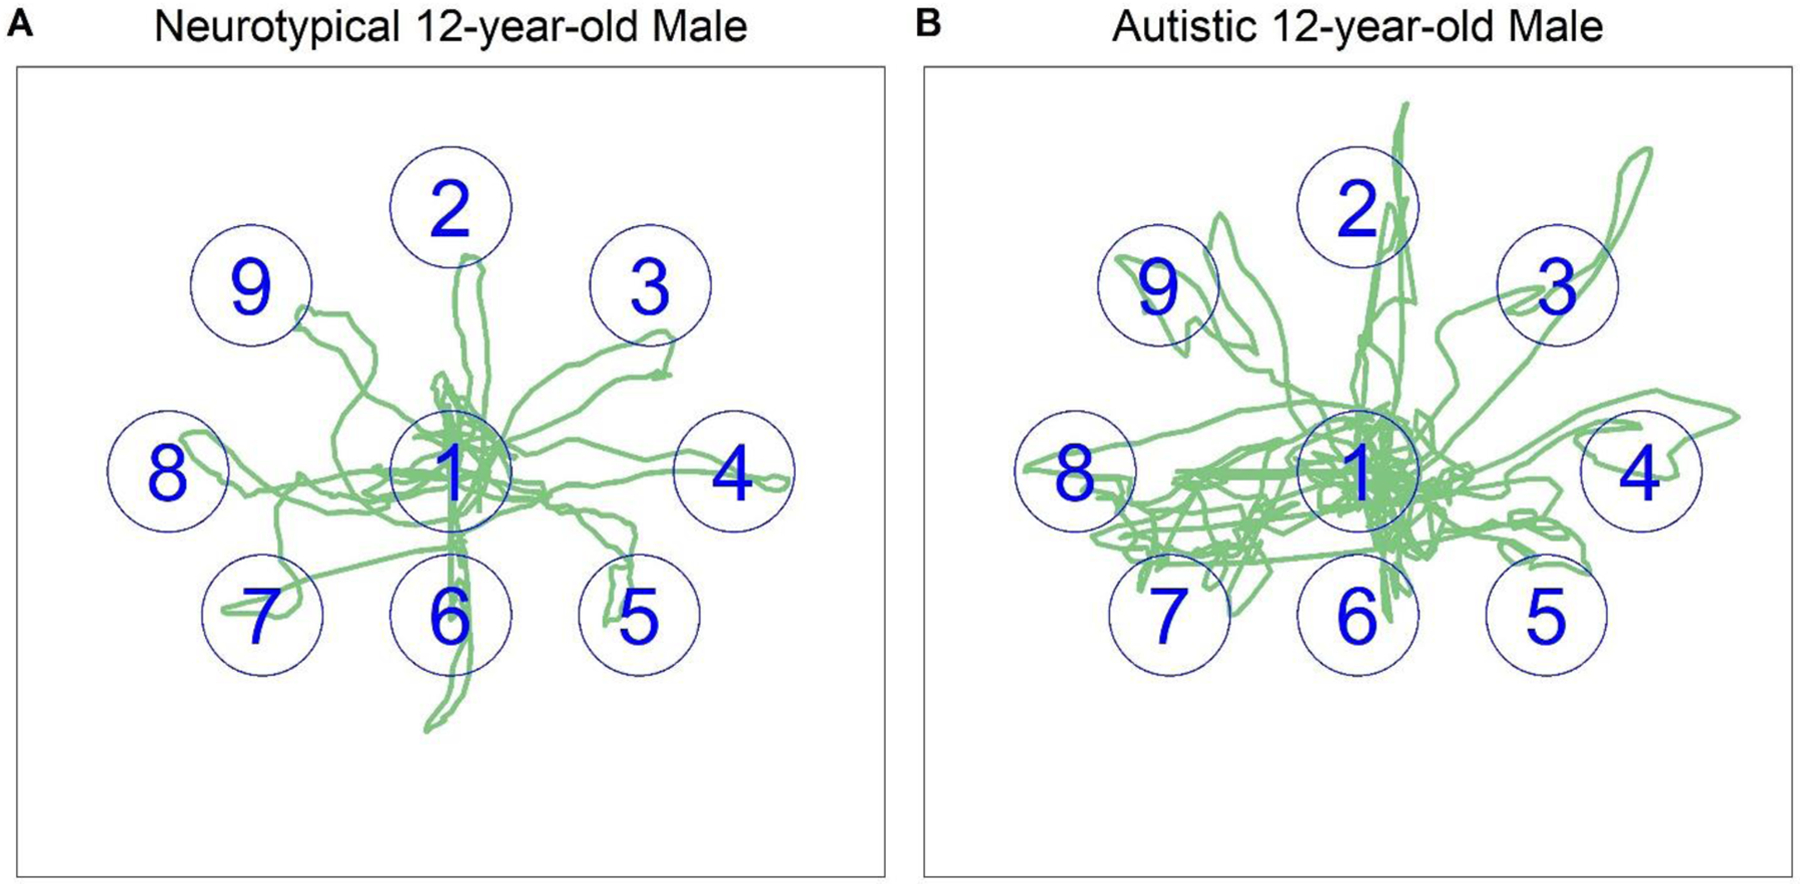
Figure 4.

Sway plots of 12-year-old (A) neurotypical and (B) autistic male participants during the Limits of Stability Task. 1=Center, 2=Forward, 3= Forward/Right, 4=Right, 5=Backward/Right, 6=Backward, 7=Backward/Left, 8=Left, 9=Forward/Left. Note: Target position is correct, but size is approximated for plotting purposes.
