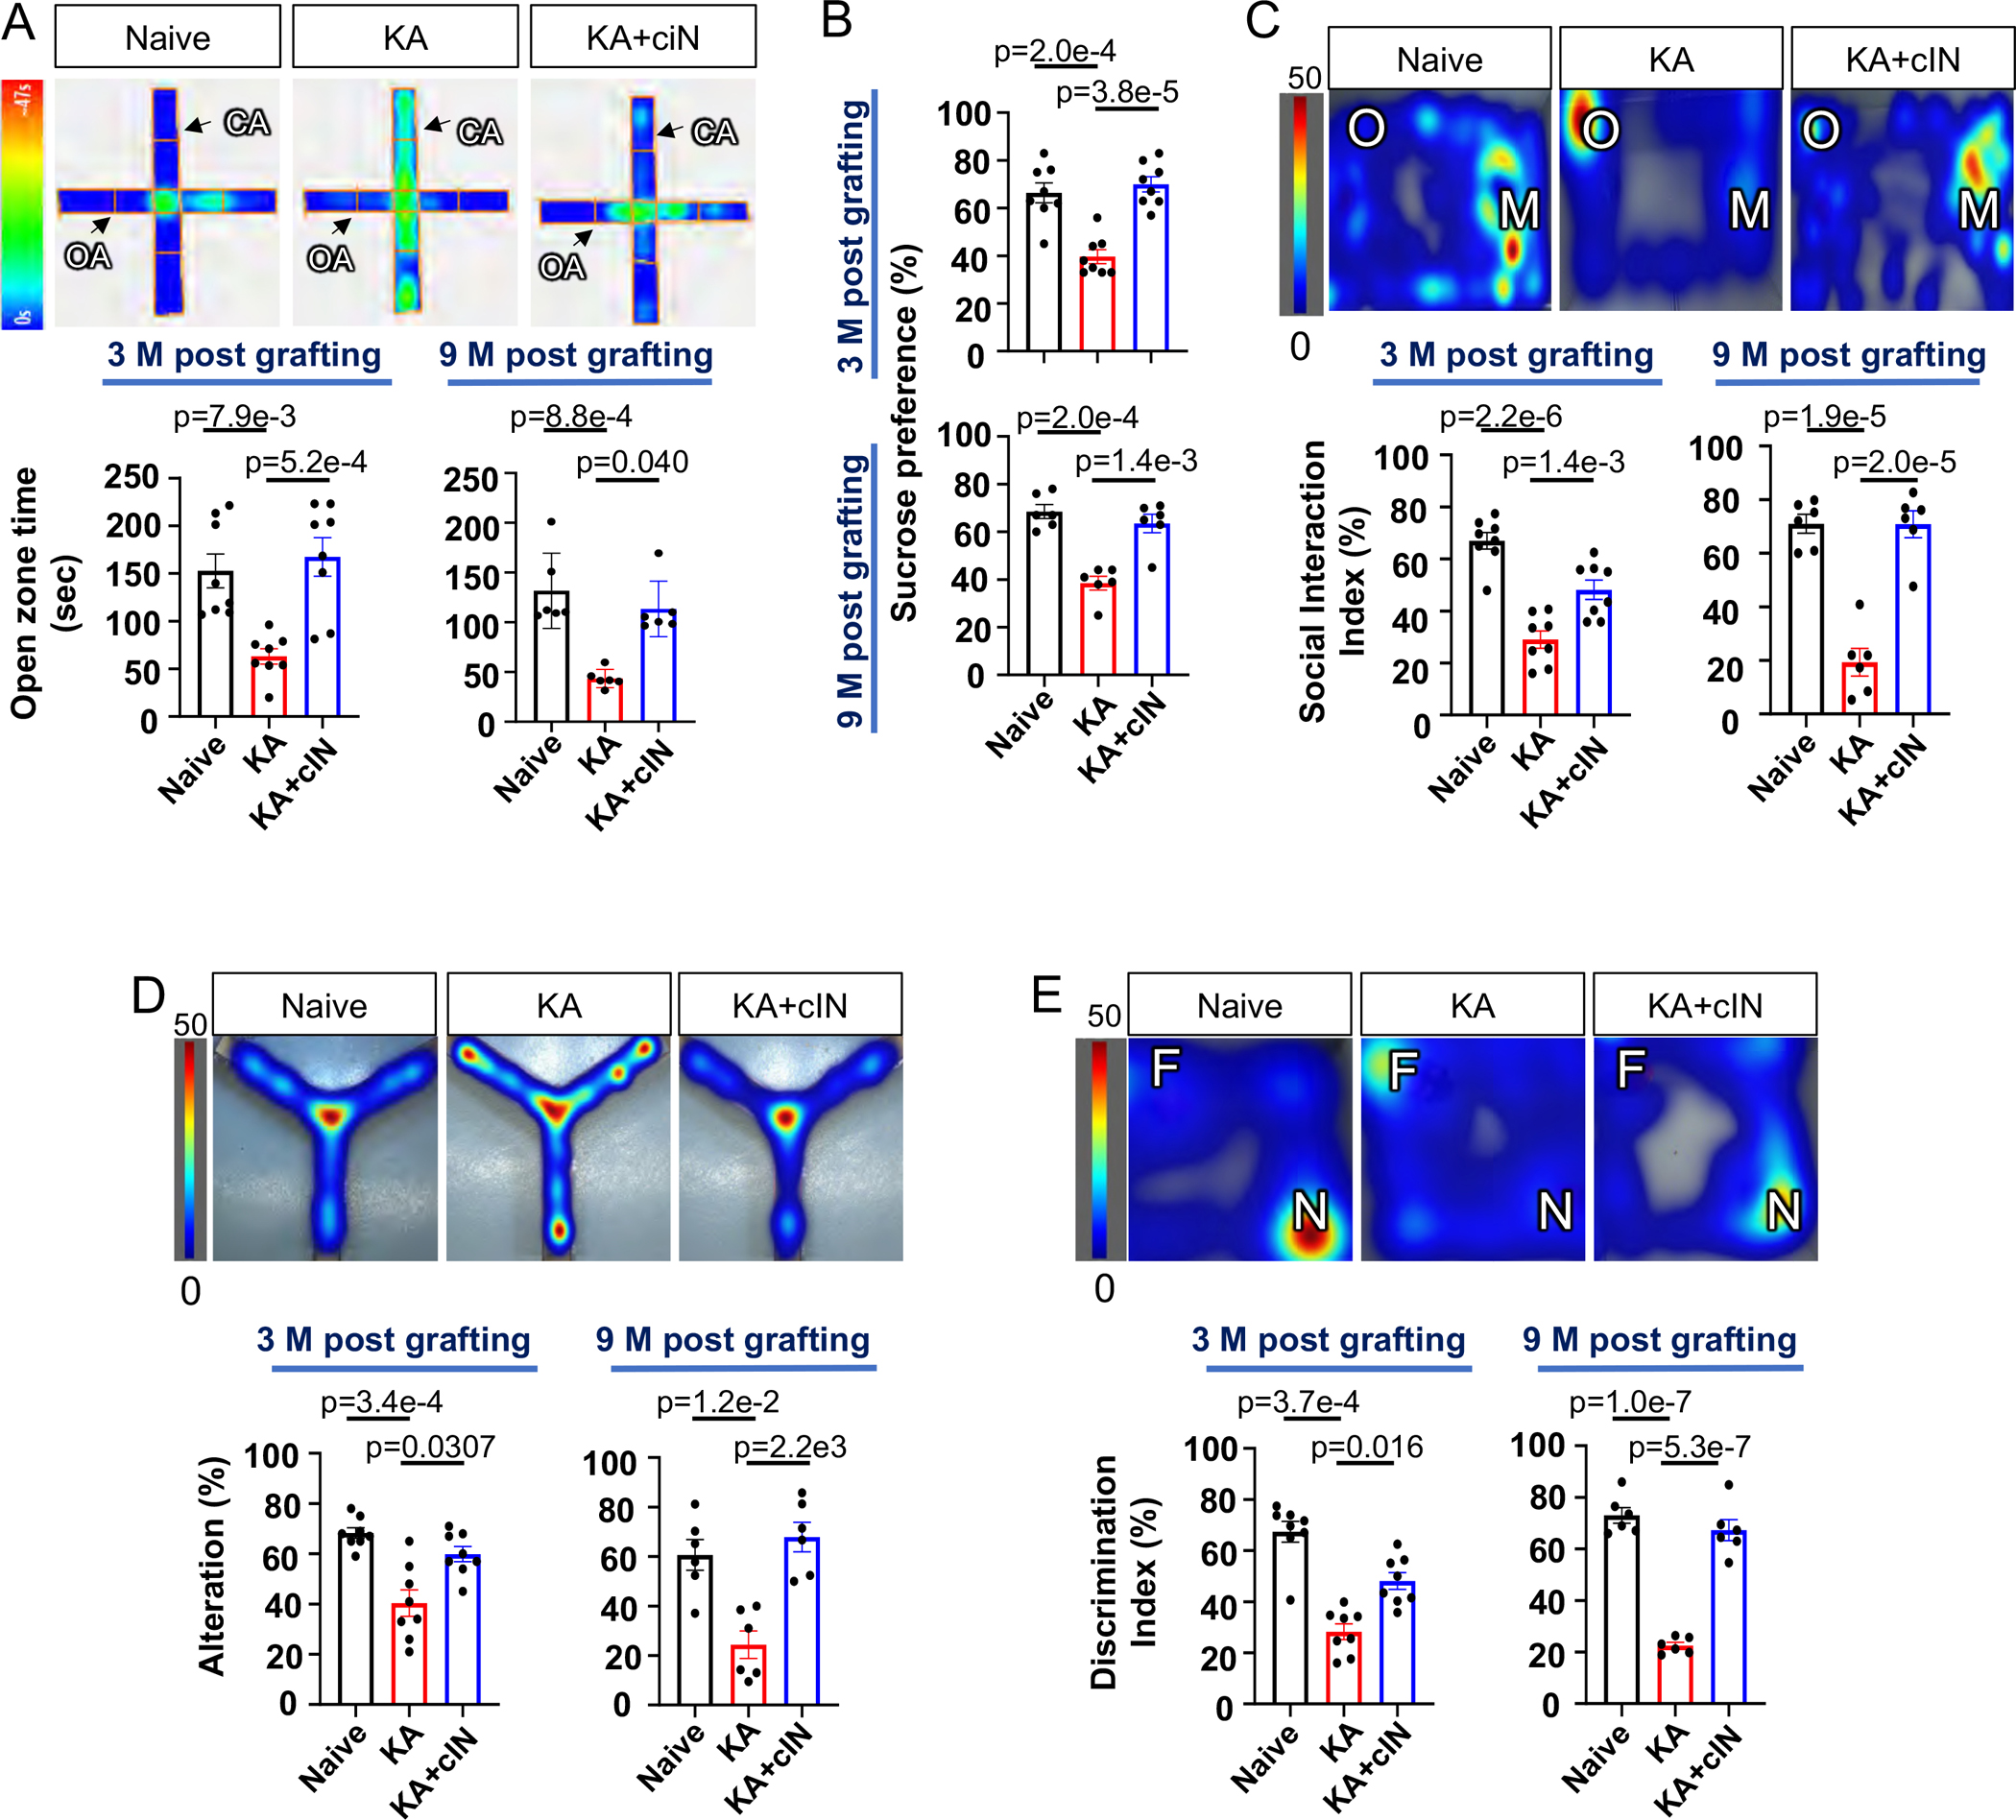
Fig. 5. Chemically matured human cIN grafts restore comorbid behavioral deficits.

(A) EPM analysis of human cIN-grafted KA-TLE mice. Upper panel: representative heat map image. Lower panel: time spent in open arms by naïve, KA-TLE and KA-TLE + cIN groups at three months and nine months post-transplant.
(B) Sucrose preference test in naïve, KA-TLE and KA-TLE + cIN groups at three months and nine months post-transplant.
(C) Social interaction test. Upper panel: representative heat map image. Lower panel: Social interaction index in naïve, KA-TLE and KA-TLE + cIN groups at three months and nine months post-transplant.
(D) Y-maze analysis. Upper panel: representative heat map image. Lower panel: % of alteration of naïve, KA-TLE and KA-TLE + cIN groups at three months and nine months post-transplant.
(E) Novel object recognition test. Upper panel: representative heat map image. Lower panel: discrimination index of naïve, KA-TLE and KA-TLE + cIN groups at three months post-transplant and nine months post-transplant.
Heat map indicates total duration of stay (in seconds) in a given spot. Error bars are the SEM. See also Fig S9.
