
Figure 5.
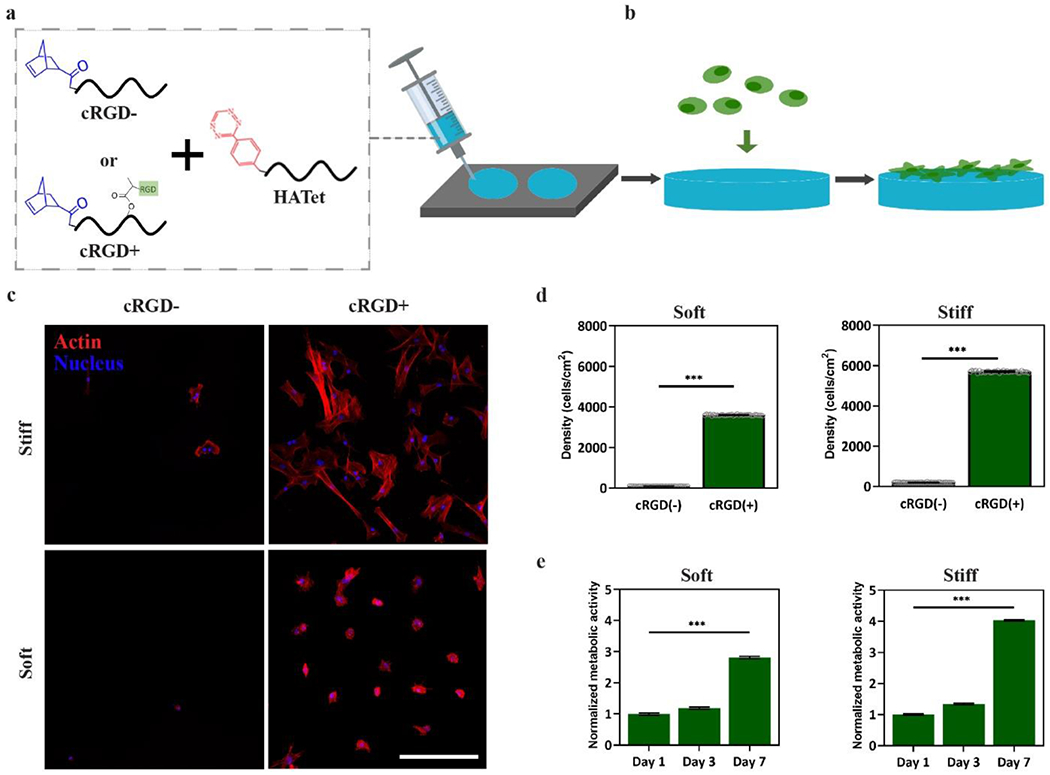
2D cell attachment and proliferation on cRGD-functionalized Nor-Tet hydrogels. (a) HANor macromers with or without cRGD functionalization were mixed with HATet, injected into cylindrical molds, and (b) MSCs were cultured on cRGD+ and cRGD- Nor-Tet hydrogels. (c) Representative maximum projection images (actin, red; nuclei, blue) of MSCs on Soft or Stiff Nor-Tet hydrogels with or without covalently bound cRGD. Confocal images were used to determine MSC Density (number of nuclei cm−2) on (d) Soft and Stiff Nor-Tet hydrogels with or without cRGD. AlamarBlue assay was performed on day 1, 3, and 7 to quantify normalized metabolic activity of MSCs on RGD-functionalized (e) Soft and Stiff Nor-Tet hydrogels. Bar graphs shown as mean ± SD (n ≥ 3 samples per condition) with significant differences determined with ANOVA followed by Tukey’s post hoc test where ***p < 0.001. Scale bar: 500 μm.