
Figure 7.
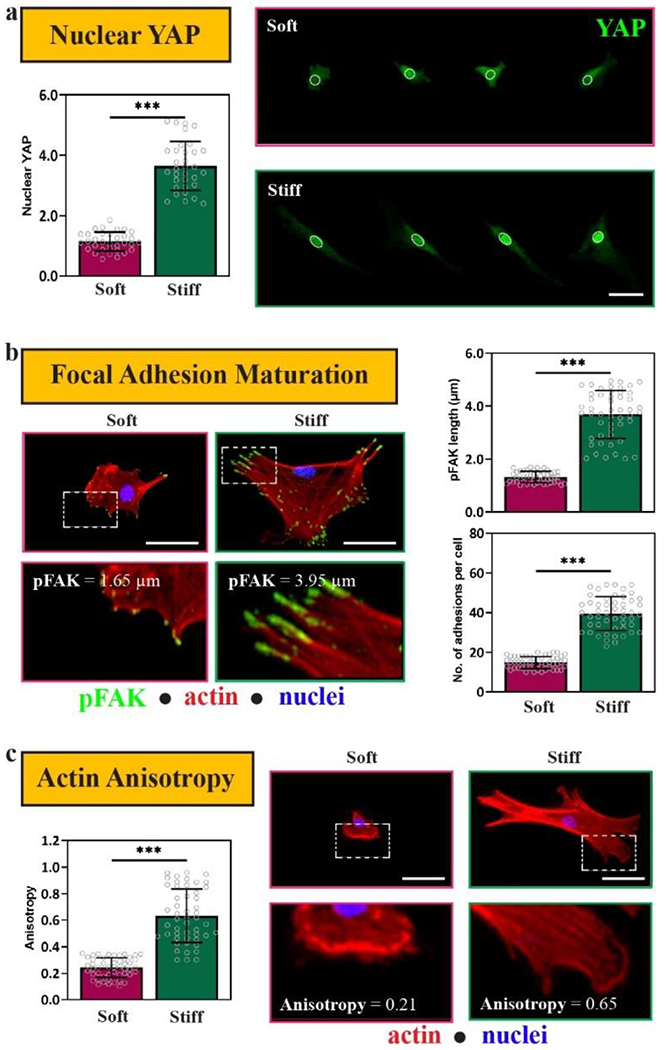
MSCs are mechanosensitive on 2D Soft and Stiff Nor-Tet hydrogels. (a) Representative images and Nuclear YAP (green) quantification of MSCs on Soft and Stiff Nor-Tet hydrogels. (b) Representative images of MSCs stained for pFAK (green), phalloidin (red), and nuclei (blue) and quantification of pFAK maturation (length, average number of adhesions per cell) of MSCs on Soft and Stiff Nor-Tet hydrogels. Bar graphs shown as mean ± SD (n ≥ 3 samples per condition) with significant differences determined with ANOVA followed by Tukey’s post hoc test where ***p < 0.001. Scale bars: a, b, c 50 μm.