Figure 9.

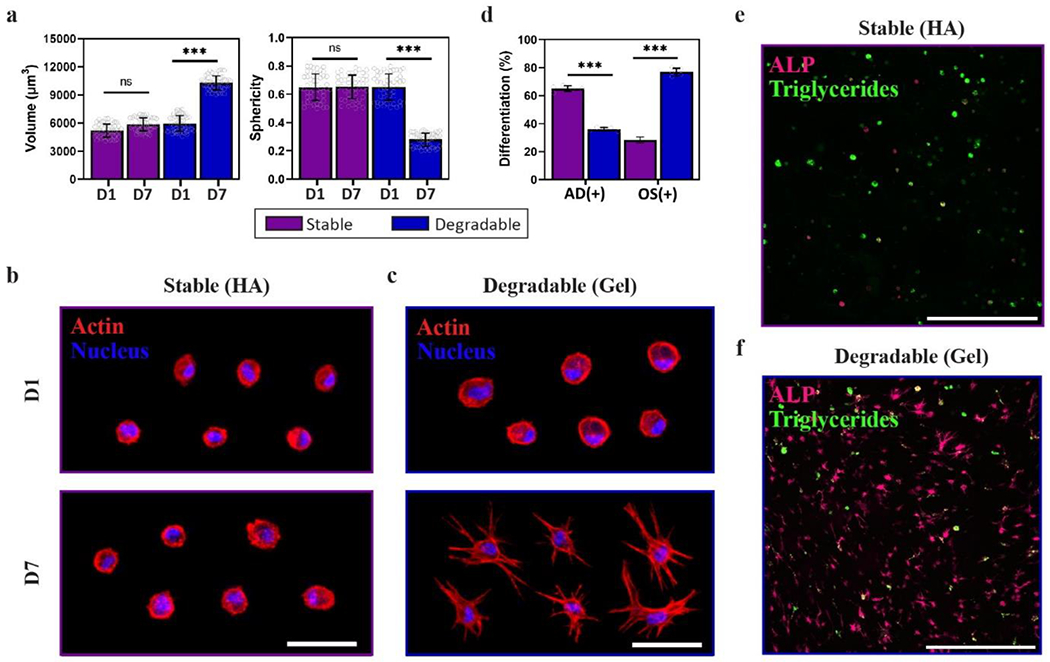
MSC spreading and differentiation can be controlled in 3D Nor-Tet hydrogels. (a) Quantification of MSC Volume (left) and Sphericity (right) of MSCs in Stable or Degradable Nor-Tet hydrogels after 1 and 7 days in culture. Representative images of MSCs stained for actin (red) and nuclei (blue) after 1 and 7 days in culture inside (b) Stable or (c) Degradable Nor-Tet hydrogels. (d) Quantification of percentage of AD(+) and OS(+) cells in Stable HA and Degradable Gel Nor-Tet hydrogels after 7 days in culture. Representative images of cells stained for ALP (magenta) and lipid droplets (green) in (e) Stable or (f) Degradable Nor-Tet hydrogels after 7 days in culture. Bar graphs shown as mean ± SD (n ≥ 3 samples per condition) with significant differences determined with ANOVA followed by Tukey’s post hoc test where ***p < 0.001 and ns is not significant. Scale bars: d 50 μm; e 500 μm.
