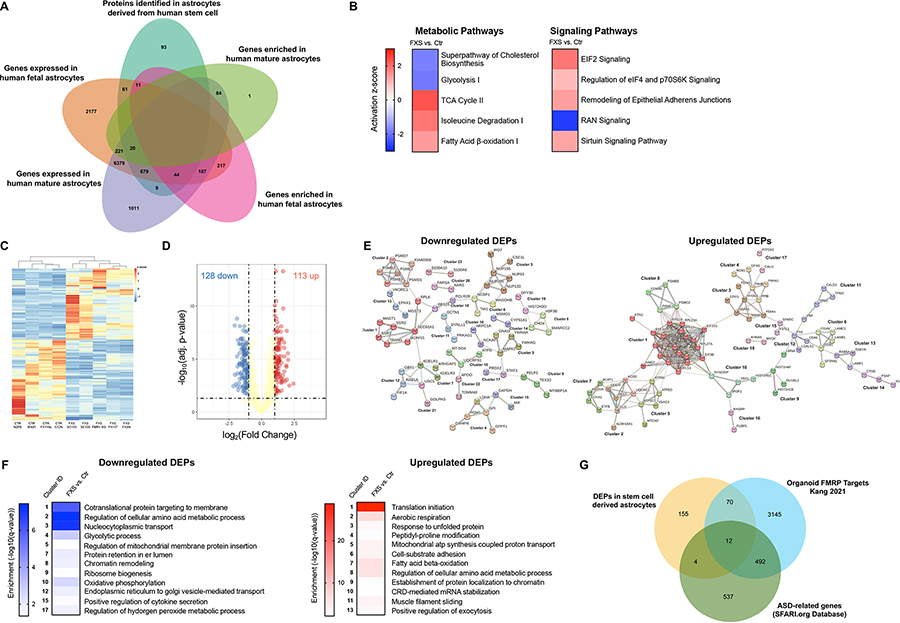
Figure 6. Proteomic profiling of control and FXS stem cell derived astrocytes.
A. The number of proteins identified in human stem cell-astrocytes in our study (teal) and its overlaps with genes expressed in human fetal astrocytes (orange), genes expressed in human mature astrocytes (lilac), genes enriched in human fetal astrocytes (pink) and genes expressed in human mature astrocytes (green) identified by Zhang et al. B. Subset of pathways with specific alterations identified by ingenuity pathway analysis in FXS hiPSC- and hESC-astrocytes. C. Heatmap with hierarchical clustering of DEPs in CTR and FXS hiPSC- and hESC-astrocytes. Values are normalized as log2(protein expression+0.0001). Columns are averaged values of biological replicates of each line. Proteins with FDR < 0.05 were defined as DEPs. D. Volcano plot of protein expression change in hiPSC- and hESC-astrocytes upon loss of FMRP. Yellow dots are proteins with FDR>0.05 or log2(Fold Change) ≤1 or ≥−1; Red and blue dots are proteins with FDR < 0.05 and log2(Fold Change) ≥1 (up) or ≤−1 (down), respectively. E Bioinformatic analysis of the DEPs using the search tool for retrieval of interacting genes (STRING) revealed protein-protein interaction (PPI) networks. 23 downregulated and 18 upregulated significant clusters were found in the DEPs PPI network analysis using STRING MCL clustering. F. Heatmaps of significant enrichment for a GO term in the clusters.

