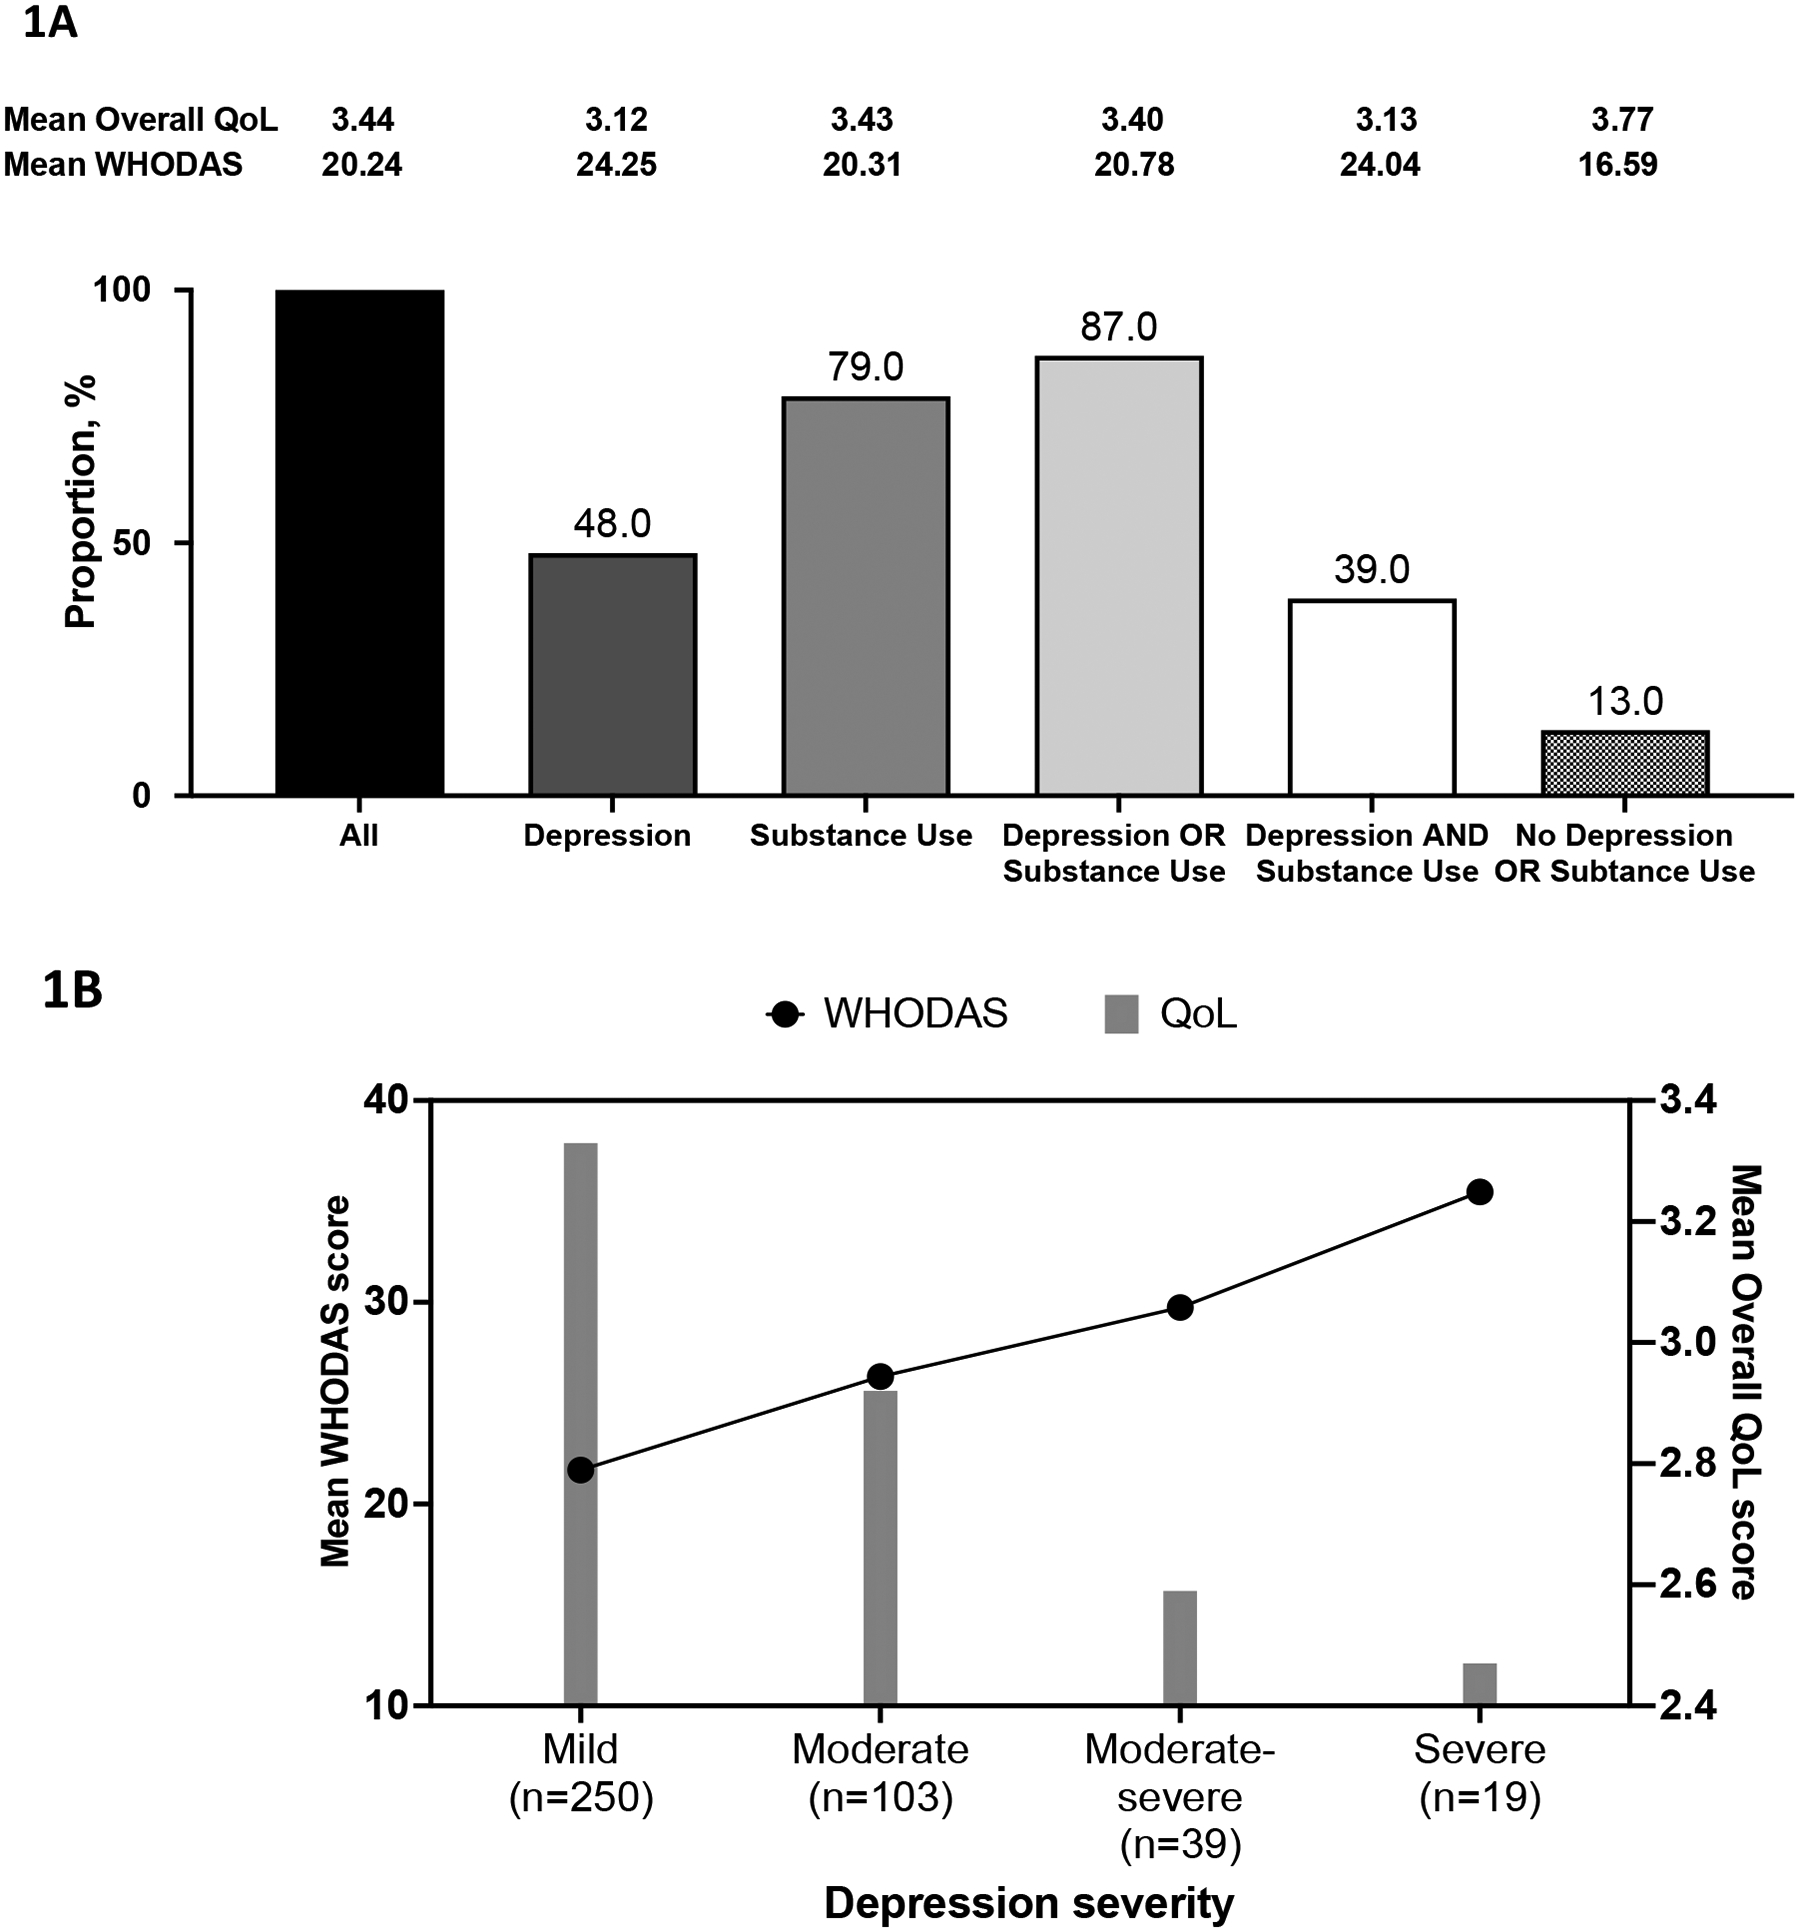
Figure 1: Distribution of PLWH screened positive for depression and/or substance use and mean scores for WHODAS 2.0 and overall Quality of Life (QoL).

(A) Distribution of participants screened positive for depression and/or substance use from all participants recruited in the study (n=864) and corresponding mean WHODAS 2.0 and overall QoL (Q1 of WHOQOL-HIV BREF) scores in each group; (B) Trends in mean WHODAS 2.0 (black line) and overall QoL scores (grey bars) by depression symptom severity assessed using the PHQ-9 in PLWH screened positive for depression in the cohort (n=411). The number of participants for each severity group is indicated in the x-axis.
