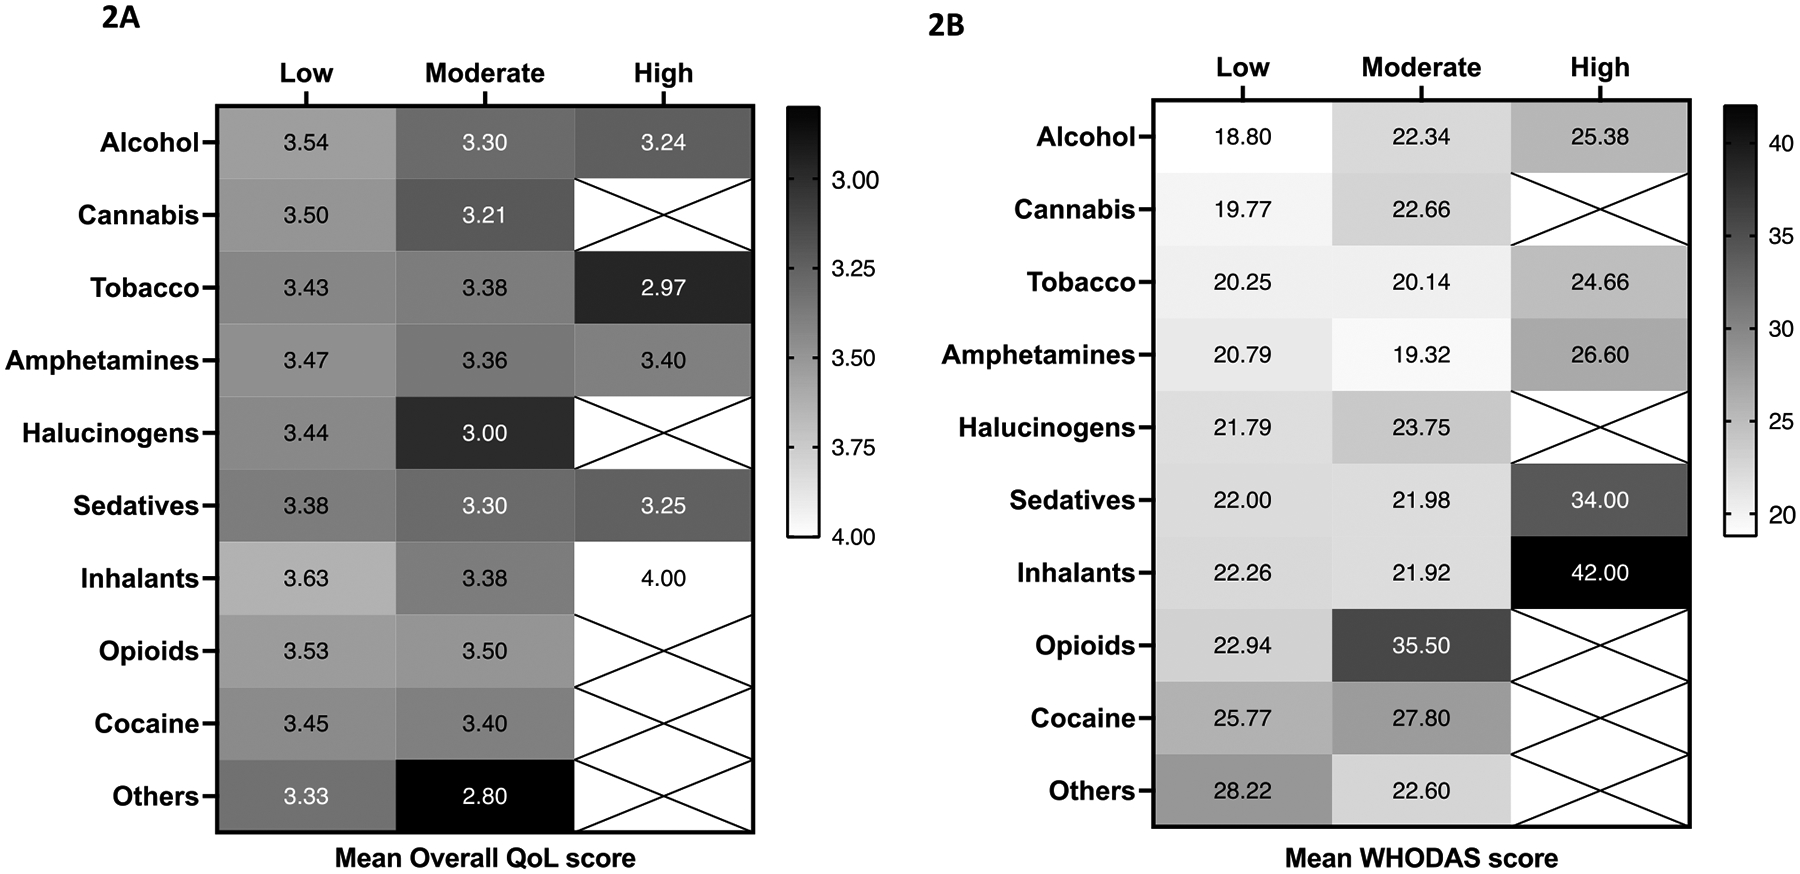
Figure 2: Heat plots describing (A) mean overall QoL and (B) WHODAS 2.0 scores among PLWH screened positive for substance use categorised by type and extent (low, moderate, high) of substance use reported (n=681).

Mean QoL and WHODAS 2.0 scores are displayed in each box for each type of substance (vertical scale) and the extent of its use (low to high-risk) (horizontal scale). Darker shades indicate poorer QoL and greater disability which corresponds with lower mean QoL and higher WHODAS scores, respectively.
