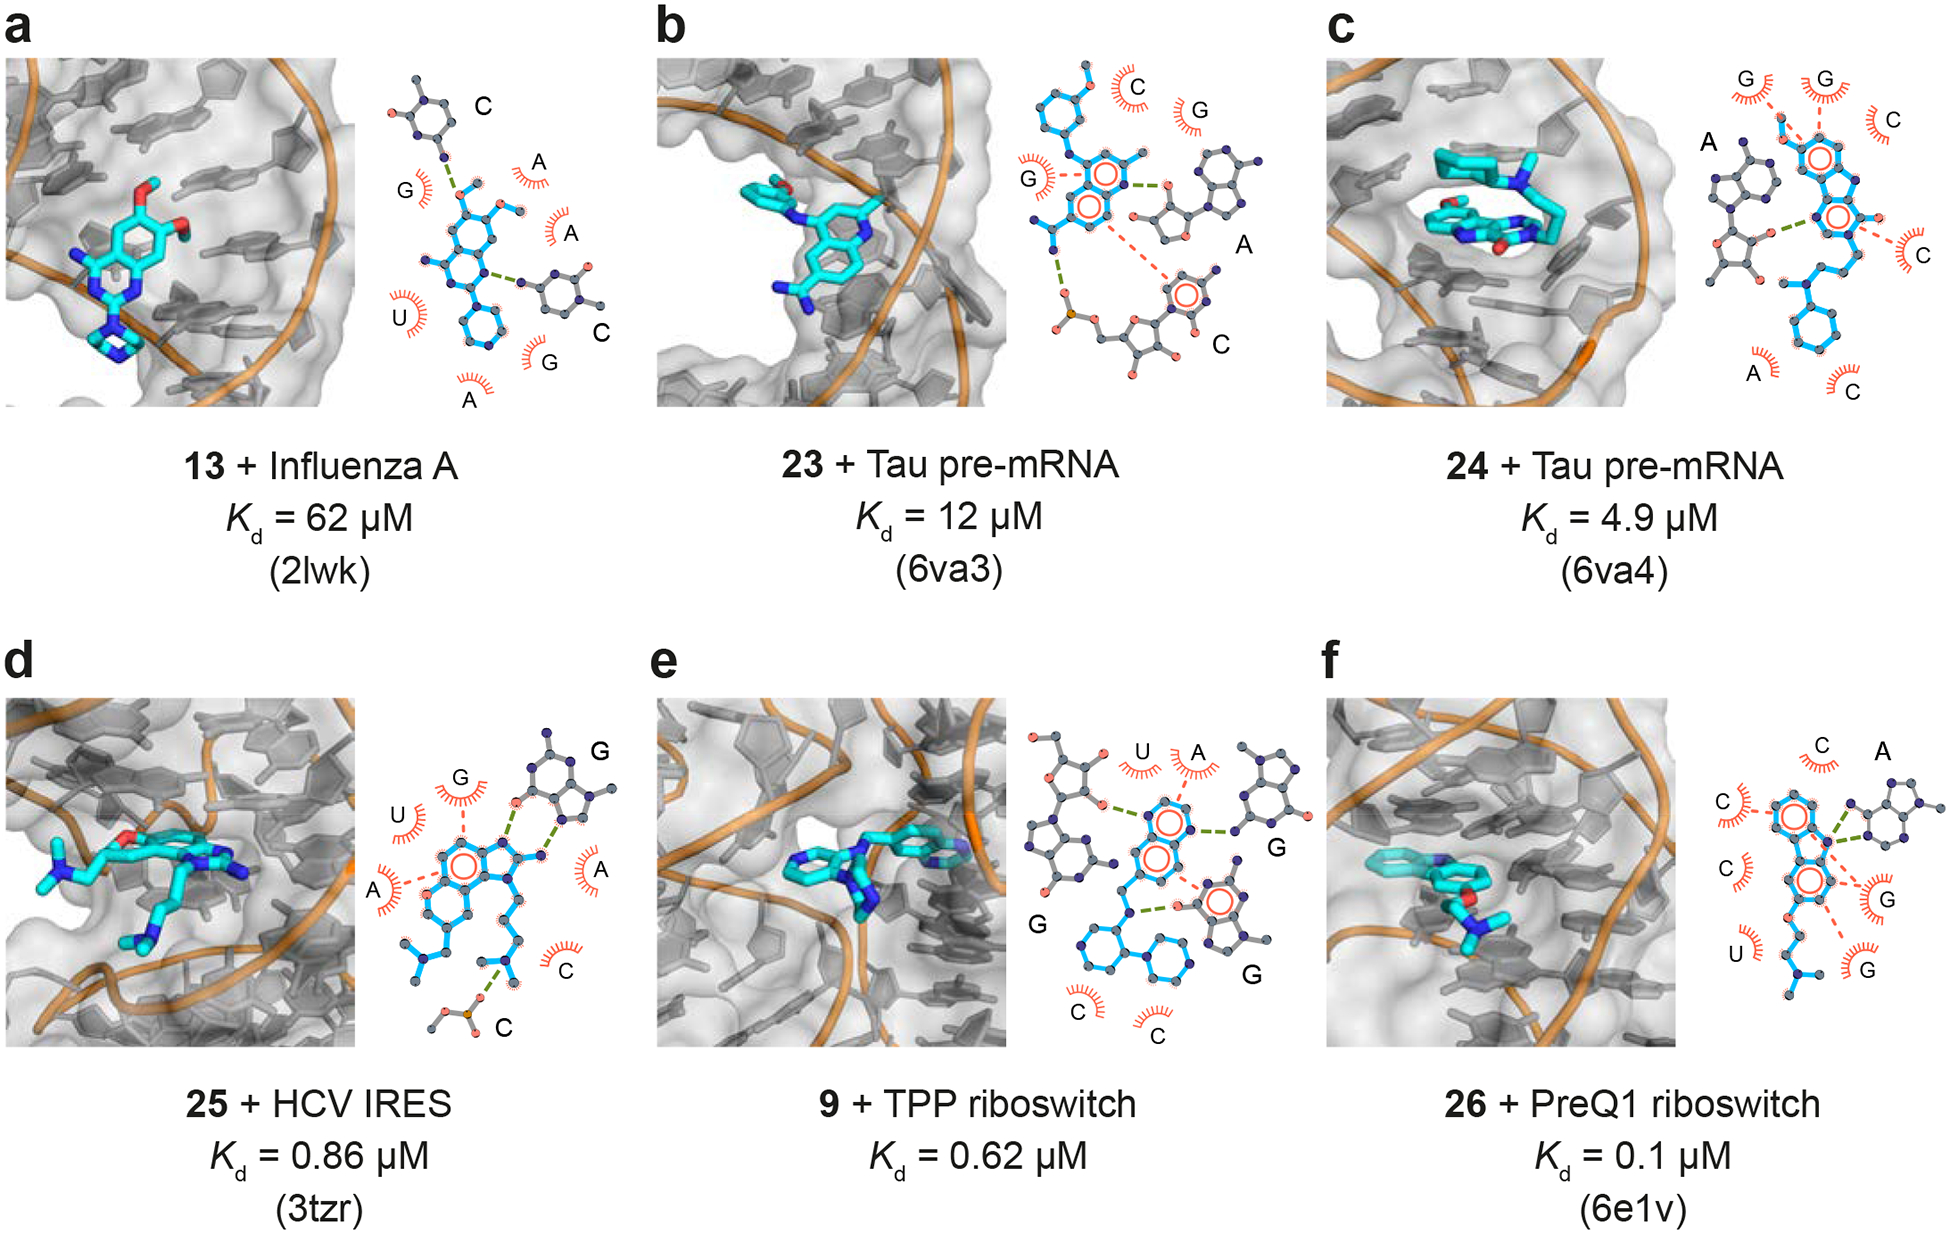
Figure 3.

Three-dimensional structures (left) and interaction maps (right) for ligands that interact (a-c) with simple RNA motifs and (d-f) with complex RNA structures. In the interaction maps, hydrogen bonds are shown with green dashed lines; π stacking is illustrated with orange circles and dashes. For NMR structures (panels a-c), interpretations of average structures are shown. Structures and interaction maps were composed with PyMOL and LigPlot+, respectively.
