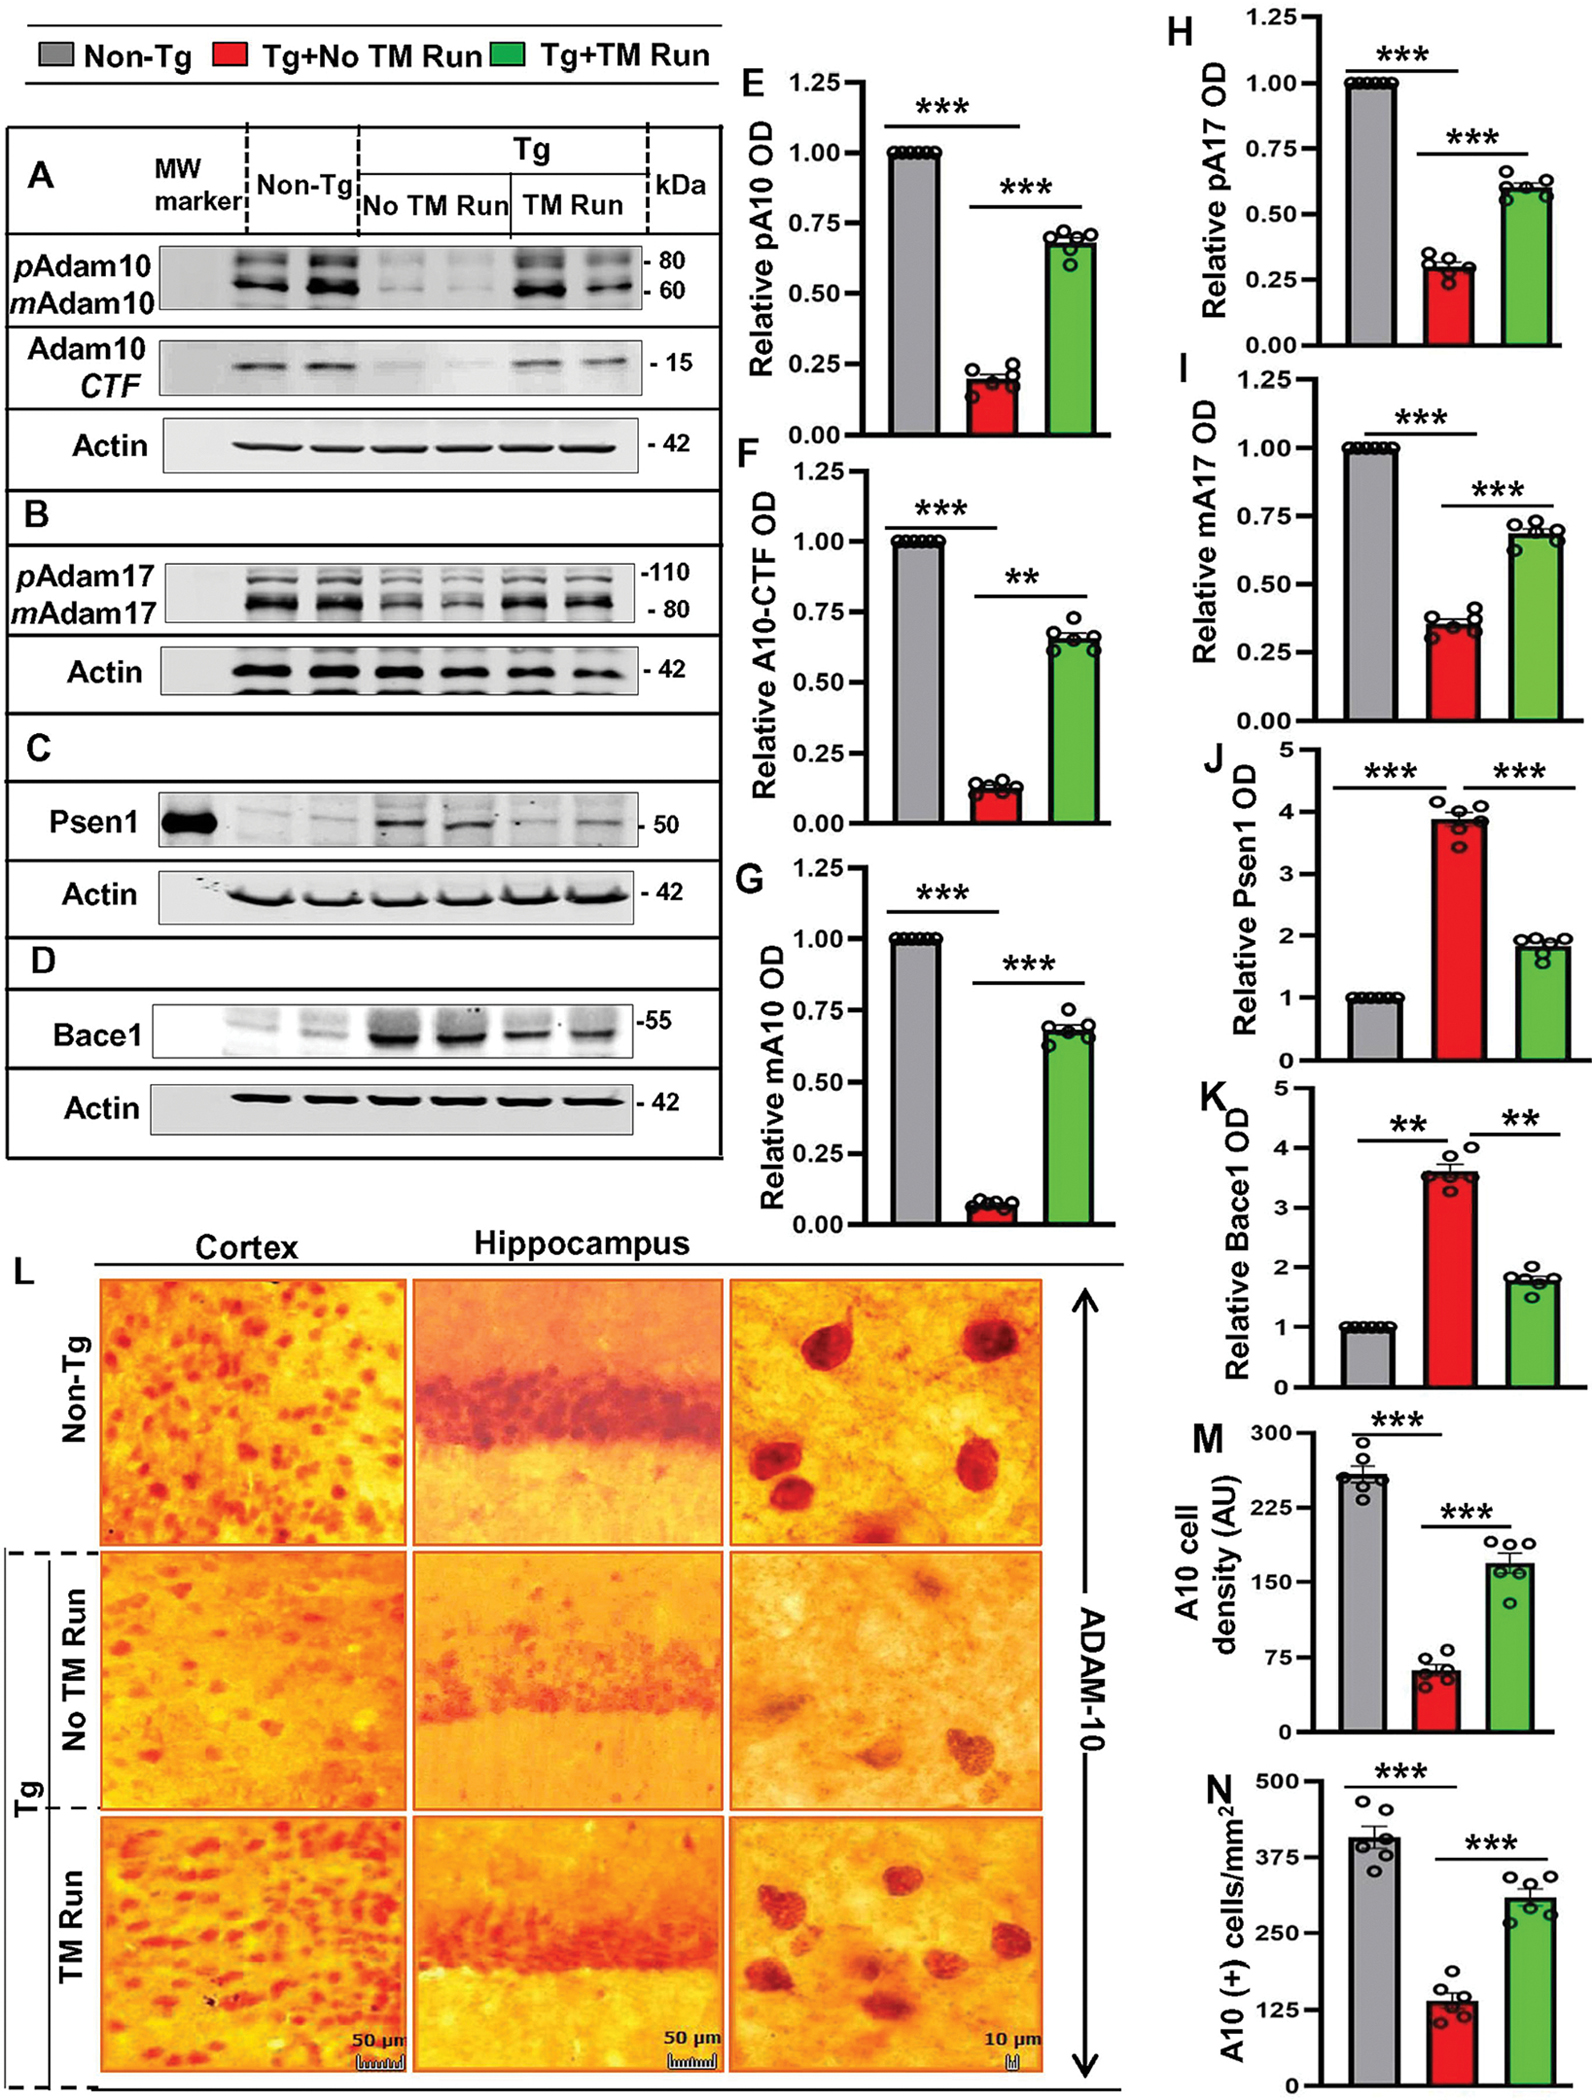
Figure 1. Treadmill exercise alters the expression of ADAM10, ADAM17, BACE1, and PSEN1 in hippocampus of Tg-mice.

Following two months of treadmill exercise, six-month-old Tg-mice (n=6/group) were sacrificed for monitoring the protein levels – pADAM10, mADAM10, pADAM17, mADAM17, Psen1, and Bace1 in hippocampus region by Western Blot using the monoclonal ADAM10 antibody. (A-D). Actin was used as the loading control. Bands were scanned and quantified using the NIH Image J software for pADAM10 (E), ADAM10-CTF (F), mADAM10 (G), pADAM17 (H), mADAM17 (I), PSEN1 (J) and BACE1 (K) and the results are represented as relative to non-Tg mice group. Results are mean ± SD of six per group. pADAM10 - ***p<0.001 (=0.0002) vs non-Tg mice and ***p<0.001 (=0.0027) vs Tg-mice with exercise; mADAM10 - ***p<0.001 (=0.0034) vs non-Tg mice and ***p<0.001 (=0.0085) vs Tg-mice with exercise; ADAM10CTF - p<0.001 (=0.0045) vs Non-Tg mice and **p<0.01 (=0.0228) vs Tg-mice with exercise; pADAM17 – ***p<0.001 (=1.3708×10⁻⁷) vs Non-Tg mice and ***p<0.001 (=2.0546×10⁻⁵) vs Tg-mice with exercise; mADAM17 - ***p<0.001 (=0.000735) vs non-Tg mice and ***p<0.001 (=5.6511×10⁻⁵) vs Tg-mice with exercise; Psen1 - ***p<0.001 (=0.0021) vs non-Tg mice and ***p<0.001 (=0.0052) vs Tg-mice with exercise; Bace1 - ***p<0.001 (=0.0023) vs non-Tg mice and ***p<001 (=0.0066) vs Tg-mice with exercise. (L) Diaminobenzidine staining was performed using the polyclonal ADAM10 antibody for demonstrating the ADAM10 expression in cortex and hippocampus region of mice with treadmill exercise and compared with non-exercise group. The density and number of cells expressing ADAM10 were quantified by using the Image J (M, N) and results are mean ± SD of six per group. Statistical analyzes was conducted by using One-way ANOVA followed by Tukey’s multiple comparison tests. The number of cells with ADAM10 expression - ***p<0.001 (=1.6537×10⁻²⁴) vs Non-Tg mice and ***p<0.001 (=2.6426×10⁻¹⁴) vs Tg-mice with treadmill exercise; average density of cells expressing ADAM10 - ***p<0.001 (=8.6301×10−49) vs non-Tg mice and ***p<0.001 (=2.5534×10⁻²⁹) vs Tg-mice with treadmill exercise. Abbreviations: pADAM10 - proADAM10; mADAM10 - matureADAM10; pADAM17 - proADAM17; mADAM17 - matureADAM17; ns – Non-significant.
