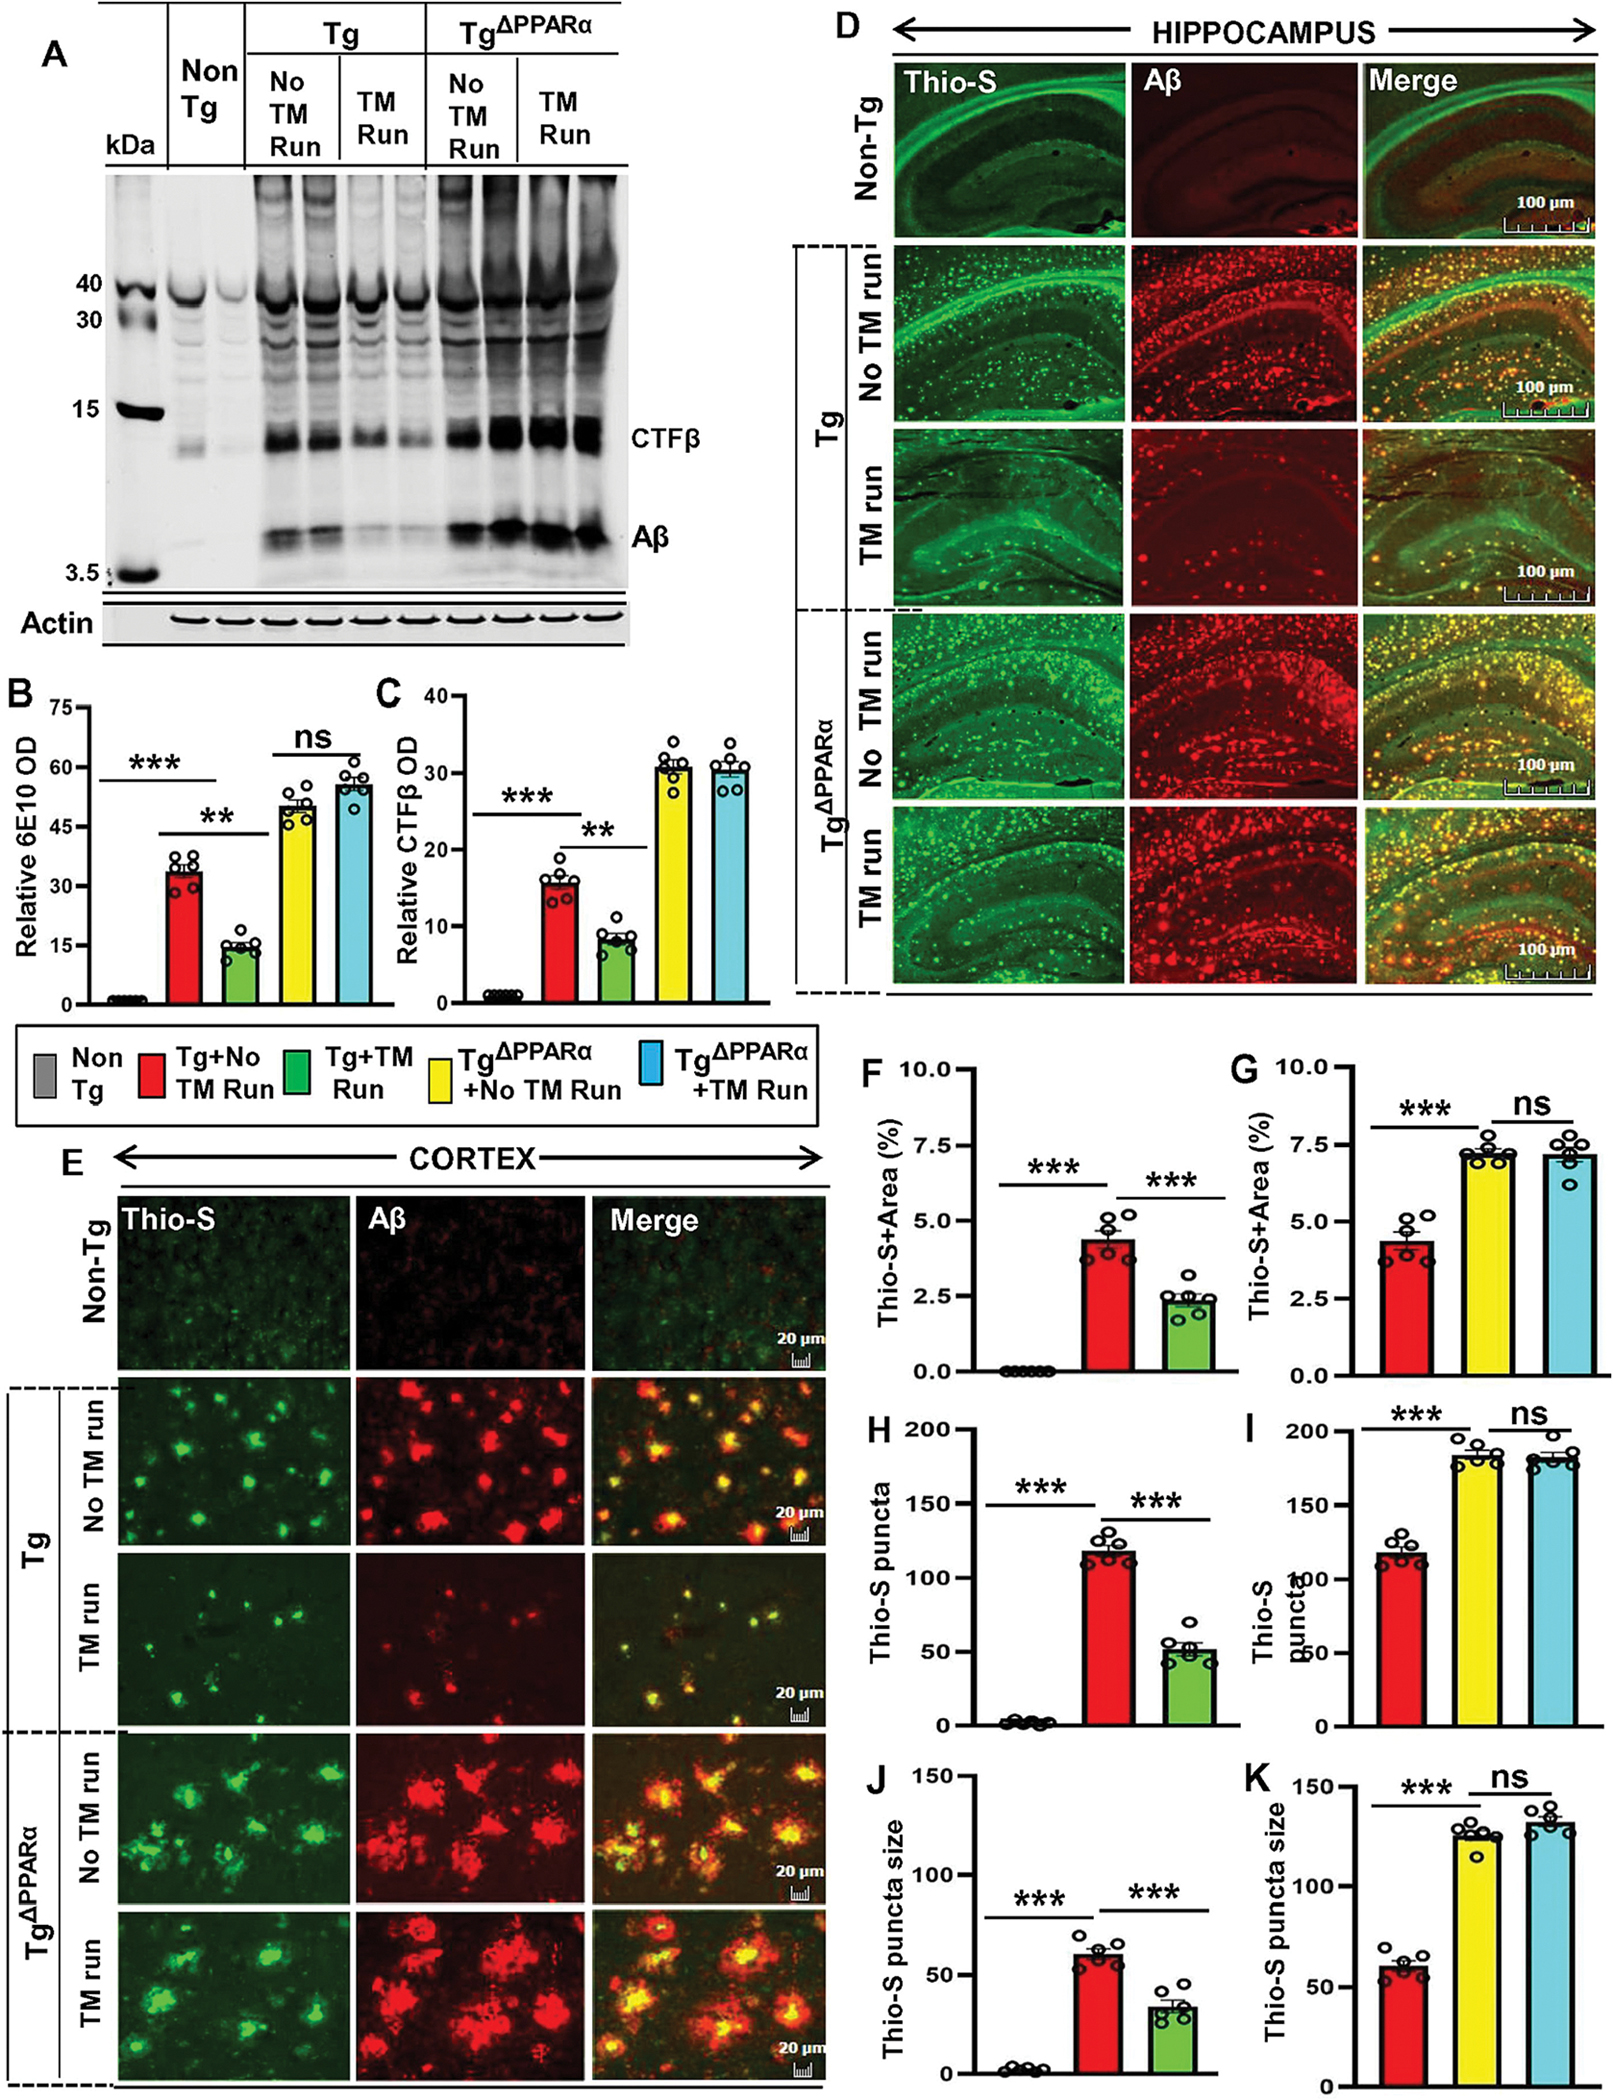
Figure 5. Treadmill exercise reduces the burden of Aβ in Tg-mice via the PPARα pathway.

Aβ level was analyzed in six-month-old Tg-mice and TgΔPPARα mice after treadmill exercise and compared with non-exercise group of mice. Using the 6E10 monoclonal antibody, the level of Aβ proteins were examined in the hippocampal homogenates of mice by the Western blot (A). Actin was used as the loading control. All the protein bands were scanned and densitometric analysis representing mean ± SD for Aβ levels relative to non-Tg controls. Quantification of relative Aβ level (B) and CTF-β level (C) in protein bands indicates - ***p<0.001(=0.0016) vs non-Tg mice; ***p<0.001 (=0.0012) vs Tg-mice with exercise; ns (=0.4829) vs TgΔPPARα mice with exercise and ***p<0.001(=0.0018) vs non-Tg mice; ***p<0.001 (=0.0025) vs Tg-mice with exercise; ns (=0.7484) vs TgΔPPARα mice with exercise. (D, E) Hippocampal sections were double-labeled using the Thio-S and Aβ 6E10 antibody for demonstrating the Aβ pathology in cortex and hippocampus region of Tg-mice and TgΔPPARα mice with and without treadmill exercise. Results are mean ± SD of six per group. All the quantification of Aβ plaques was performed using the Image J. Statistical analysis were conducted by using One-way ANOVA followed by Tukey’s multiple comparison tests. Thio-S positive plaques in hippocampus and cortex were further characterized for (F, G) the total area fraction (Thio-S area as a percentage of total hippocampal area) - ***p<0.001(=1.8100×10⁻¹⁸) vs non-Tg mice and ***p<0.001(=8.9453×10⁻⁹) vs Tg-mice with exercise; ns (=0.1552) vs TgΔPPARα mice with exercise; (H, I) the plaque count - ***p<0.001 (=1.9361×10⁻²⁶) vs non-Tg mice and ***p<0.001 (=2.0106×10⁻¹¹) vs Tg-mice with exercise; ns (=0.3492) vs TgΔPPARα mice with exercise; (J, K) the average plaque size – p***0.001 (=4.6257 ×10⁻¹⁴) vs non-Tg mice and ***p<0.001(=9.9493×10⁻⁷) vs Tg-mice with exercise; ns (=0.5694) vs TgΔPPARα mice with exercise. ns – Non-significant.
