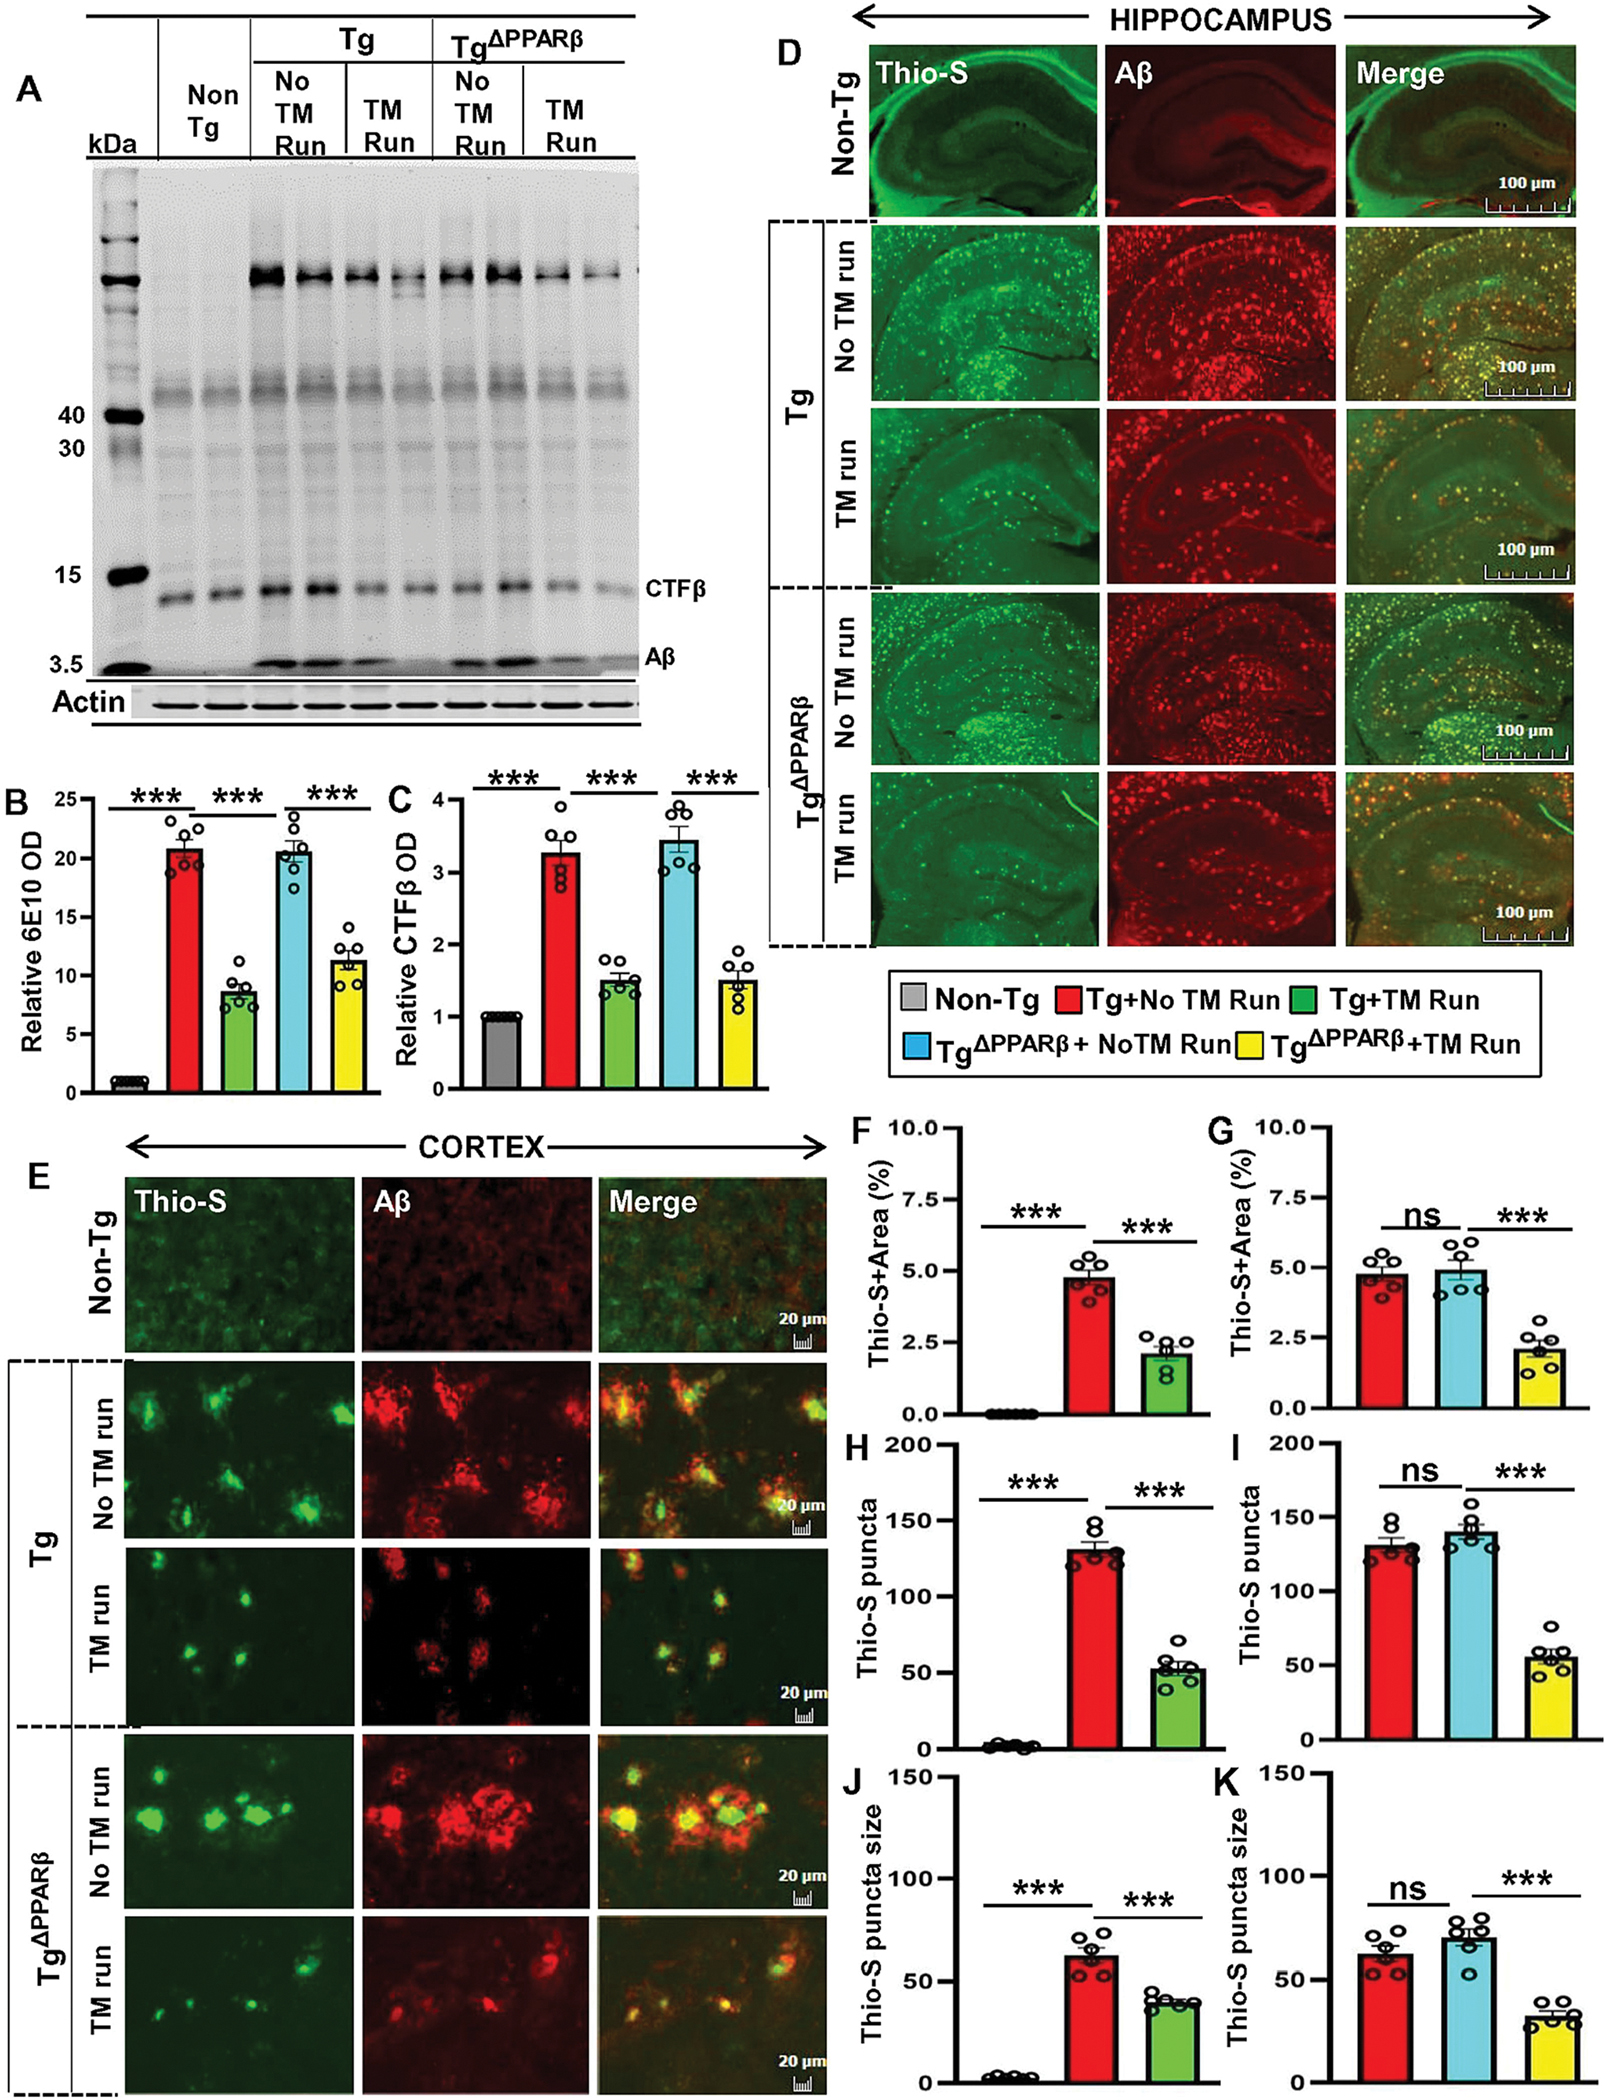
Figure 6. Treadmill exercise reduces the burden of Aβ in TgΔPPARβ mice.

Following the treadmill exercise, the level of Aβ proteins were examined in six-month old Tg-mice and TgΔPPARβ mice (n=6/group) and compared with non-exercise groups of mice. Using the 6E10 monoclonal antibody, the Aβ levels was analyzed in the hippocampal homogenates in Tg-mice and TgΔPPARβ mice by the Western blot (A). Actin was used as the loading control. All the protein bands were scanned and densitometric analysis representing mean ± SD for Aβ levels relative to non-Tg controls. Quantification of protein bands for (B) relative Aβ level indicates - ***p<0.001(=0.0051) vs non-Tg mice; ***p<0.001 (=0.0016) vs Tg-mice with exercise; ***p<0.01 (=0.0115) vs TgΔPPARβ mice with exercise and (C) CTF-β level - ***p<0.001 (=9.4200 ×10⁻⁵) vs non-Tg mice; ***p<0.001(=2.2000×10⁻⁵) vs Tg-mice with exercise; ***p<0.001 (=0.0002) vs TgΔPPARβ mice with exercise. (D, E) Hippocampal sections were double labeled using Thio-S and Aβ 6E10 antibody for demonstrating the Aβ pathology in cortex and hippocampus region of Tg-mice and TgΔPPARβ mice with and without treadmill exercise. Results are mean ± SD of six per group. All the quantification of Aβ plaques was performed using the Image J. Statistical analysis were conducted by using One-way ANOVA followed by Tukey’s multiple comparison tests. Thio-S positive plaque in hippocampus and cortex were further characterized for (F, G) the total area fraction (Thio-S area as a percentage of total hippocampal area) - ***p<0.001(=5.9402×10⁻⁹) vs non-Tg mice and ***p<0.001 (=8.8417×10⁻⁶) vs Tg-mice with exercise; ***p<0.001 (=0.0007) vs TgΔPPARβ mice with exercise; (H, I) the average plaque size – p***0.001 (=9.5979×10⁻¹¹) vs non-Tg mice and ***p<0.001 (=3.9553×10⁻⁵) vs Tg-mice with exercise; ***p<0.001 (=6.3974×10⁻⁵) vs TgΔPPARβ mice with exercise; (J, K) the plaque count - ***p<0.001 (=1.1730×10⁻¹¹) vs non-Tg mice and ***p<0.001 (=8.0403×10⁻¹¹) vs Tg-mice with exercise; ***p<0.001 (=4.0153×10⁻⁸) vs TgΔPPARβ mice with exercise. ns – Non-significant.
