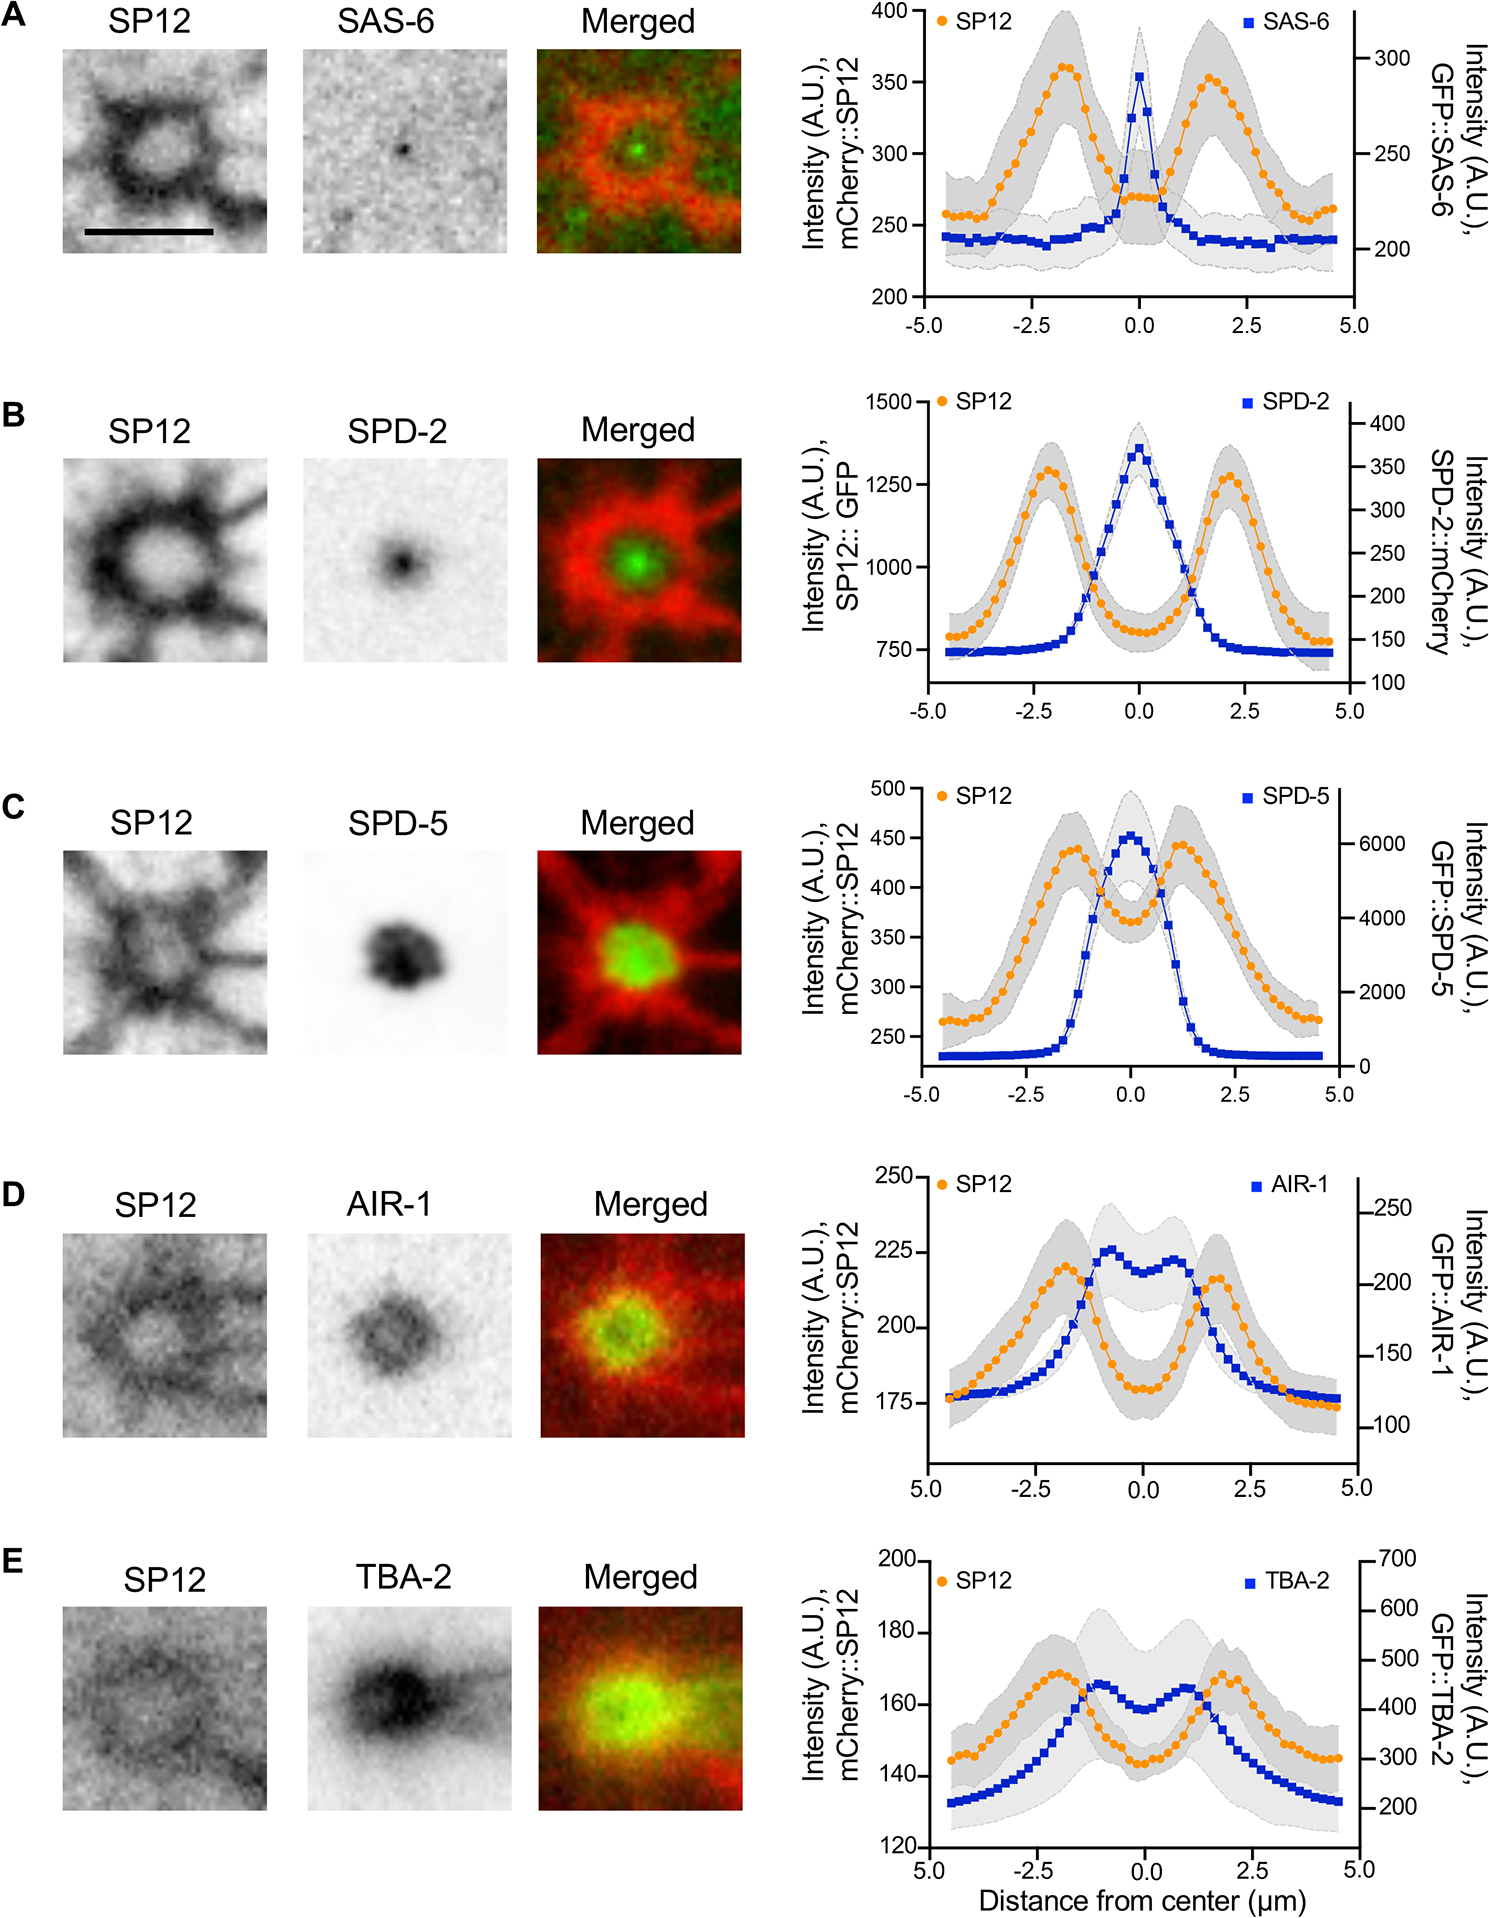
Figure 3: The centrosome is encased by the centriculum.

(A-E) The spatial relationship between the centriculum (detected using mCherry::SP12 or SP12::GFP) and the following components of the centrosome in a 1-cell stage embryo at metaphase: GFP::SAS-6 (strain OCF124, n=6 centrosomes), SPD-2::mCherry (OCF127, n=10 centrosomes), GFP::SPD-5 (OCF176, n=6 centrosomes), GFP::AIR-1 (OCF158, n=16 centrosomes) and GFP::TBA-2 (MSN146, n=8 centrosome). Representative images are shown. Scale bar = 5 μm. Graphs show the fluorescence intensities along lines (Figure S5A) that traverse the centrosomal protein (blue) or the centriculum (orange). Error (in grey) around the mean represents 95% confidence interval. A.U. = arbitrary units. For related data see Figure S5.
