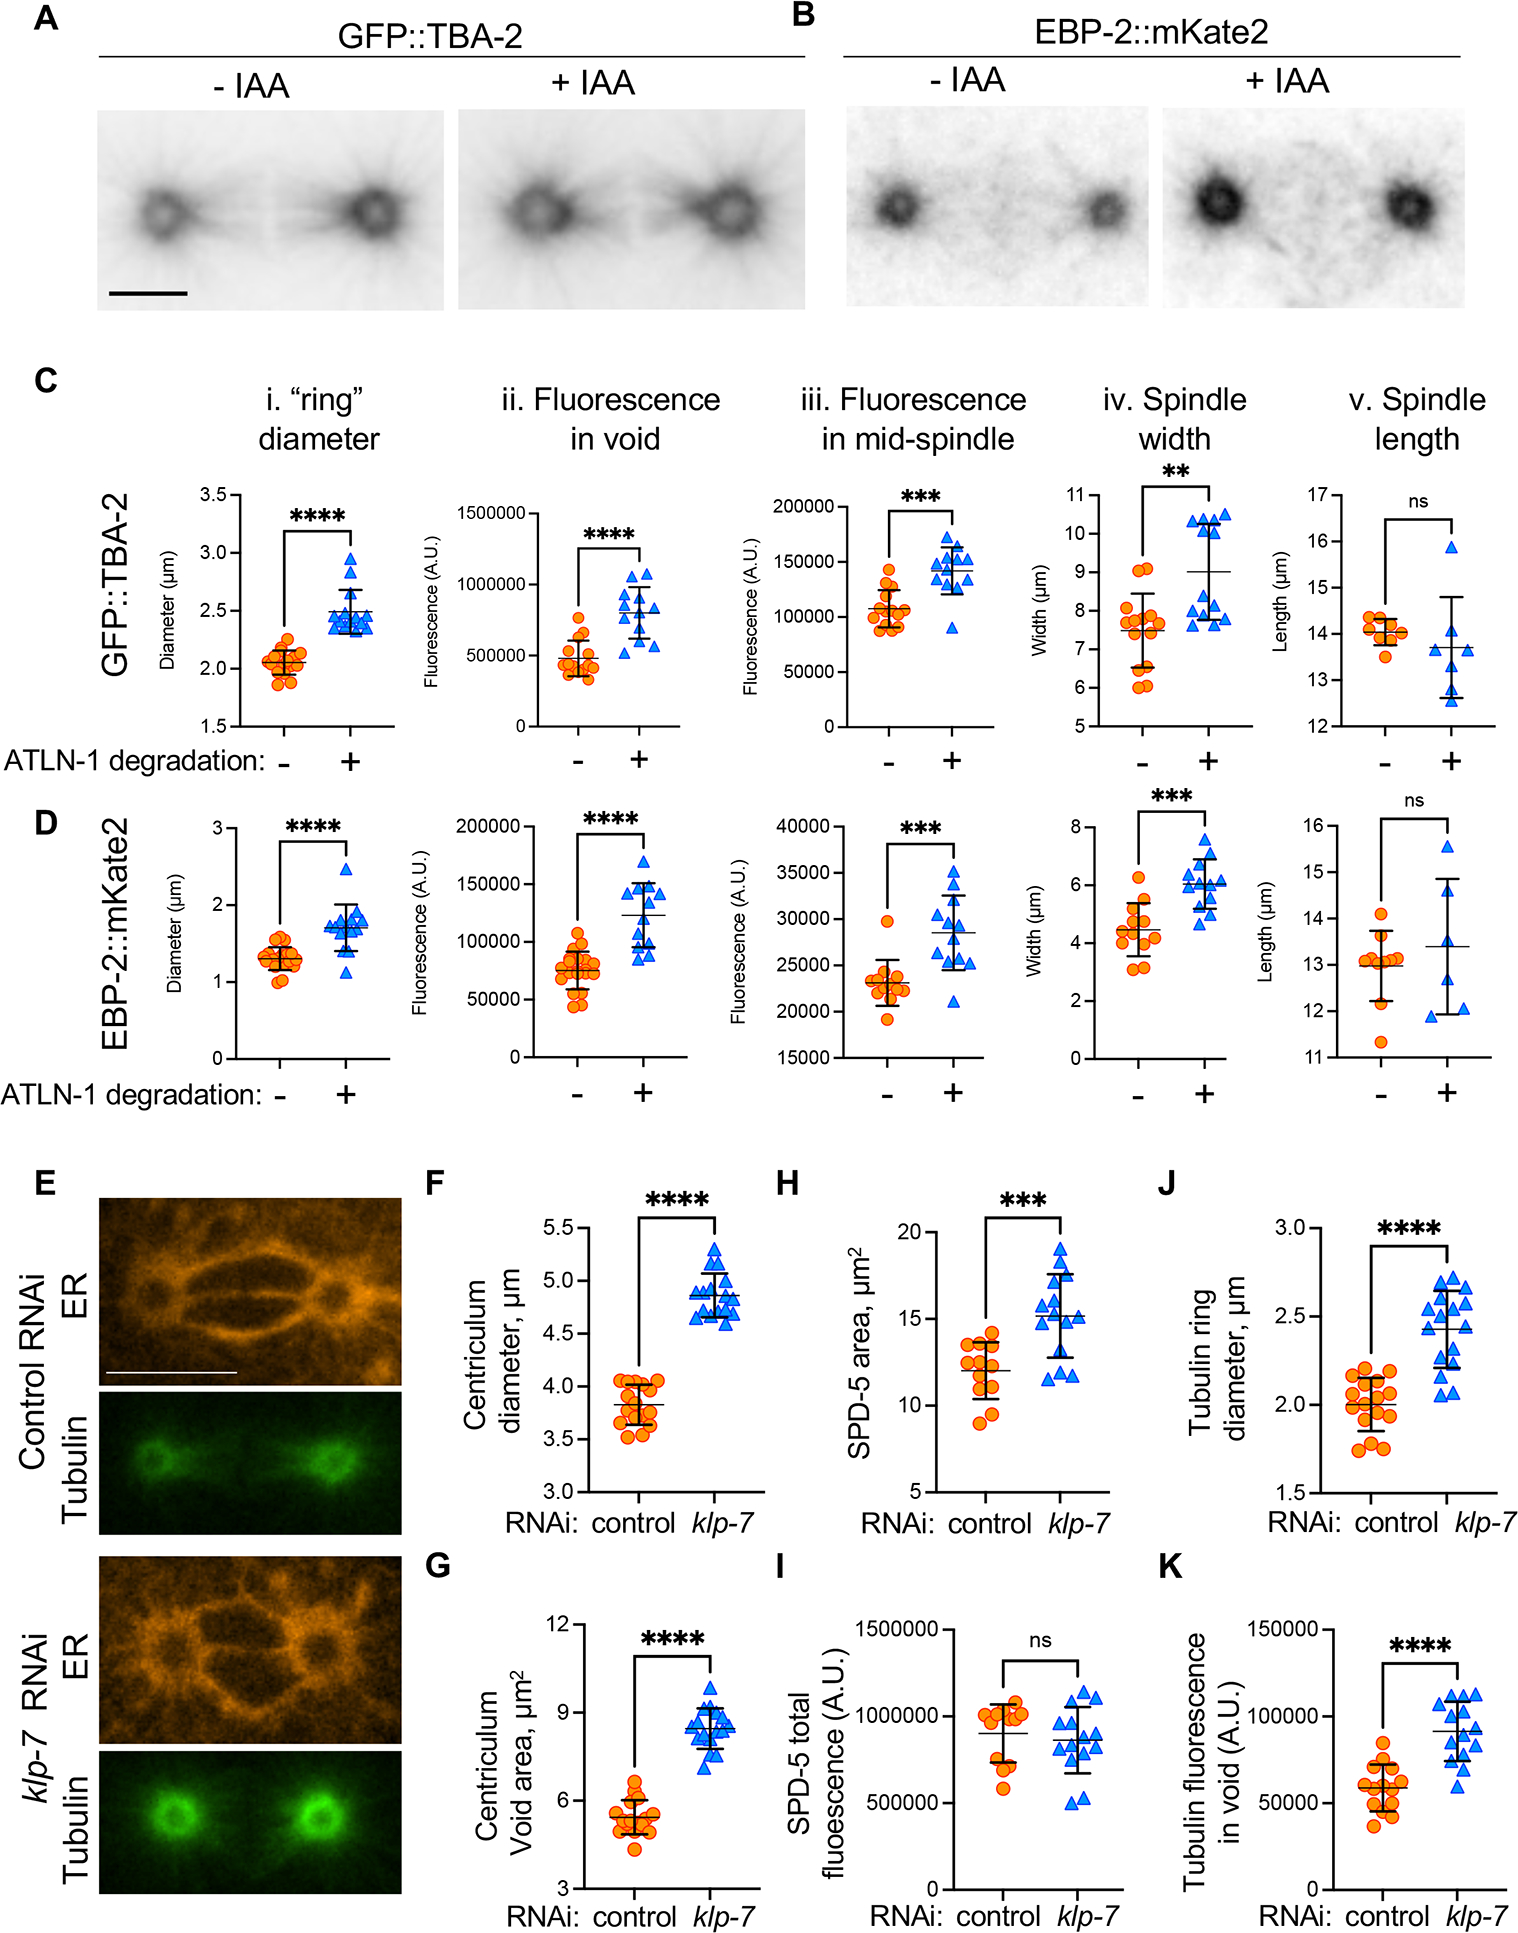
Figure 6: Centriculum expansion increases the microtubule nucleating capacity of the centrosome.

(A) A typical example of tubulin distribution in metaphase 1-cell embryo expressing GFP::TBA-2, mCherry::SP12, ATLN-1::degron and TIR1 (strain OCF183), in the absence or presence of IAA. Scale bar= 10 μm. (B) The same as panel A except cells were expressing EBP-2::mKate2 and SP12::GFP (strain OCF162). (C and D) quantification of TBA-2 or EBP-2 “ring” diameter (panel i), TBA-2 or EBP-2 fluorescence intensities in the centriculum void area (ii) and at the mid-spindle (iii), spindle width (iv), and spindle length (v) for the same strains as in panels (A) and (B), in the absence (orange symbols) or presence (blue symbols) of IAA. The methodology to quantify these parameters is shown in Figure S6A and centriculum diameters and void areas are shown in Figure S6B and C. Examples of TBA-2 and EBP-2 localization relative to the centriculum are shown in Figure S6D and E. Error bars represent mean and standard deviation. Statistical analyses were done using unpaired t test. The number of centrosomes analyzed (−/+ IAA) and p values for each panel were as follows: Ci: n=16/14, p<0.0001; Cii: n=14/12, p<0.0001; Ciii: n=14/12, p=0.0001; Civ: n=14/13, p= 0.0014; Cv: n=8/7, p=0.4205; Di: n=10/14, p<0.0001; Dii:20/12, p<0.0001; Diii: n=12/12, p=0.0007; Div: n=12/12, p=0.0002; Dv: n=10/6, p=0.4615. (E) Representative images of 1-cell metaphase embryos expressing mCherry::SP12 (orange) and GFP::TBA-2 (green) (strain MSN146) treated with control RNAi (top two panels) or RNAi against klp-7 (bottom two panels). Scale bar= 10 μm. (F-K) Measurements of centriculum diameter (F), void area (G), SPD-5 area (H), SPD-5 fluorescence in the centriculum void (I), tubulin ring diameter (J), and tubulin intensity in the centriculum void (K), in a strain expressing mCherry::SP12 and GFP::TBA-2 (MSN146, panels F, G, J and K) or mCherry::SP12 and GFP::SPD-5 (OCF176, panels H and I) that were treated with either control RNAi (orange symbols) or RNAi against klp-7 (blue symbols). Error bars represent mean and standard deviation. Statistical analyses were done using unpaired t test. The number of centrosomes analyzed (control/klp-7 RNAi) and p values for each panel were as follows: panel F: n=16/16, p<0.0001; G: n=16/16, p<0.0001; H: n=12/12, p= 0.0008; I: n=12/12, p=0.5604; J: n=16/16, p<0.0001; K: n=12/14, p<0.0001. For related data see Figure S6.
